Romanian vs Seminole In Labor Force | Age 30-34
COMPARE
Romanian
Seminole
In Labor Force | Age 30-34
In Labor Force | Age 30-34 Comparison
Romanians
Seminole
84.8%
IN LABOR FORCE | AGE 30-34
73.5/ 100
METRIC RATING
152nd/ 347
METRIC RANK
80.8%
IN LABOR FORCE | AGE 30-34
0.0/ 100
METRIC RATING
326th/ 347
METRIC RANK
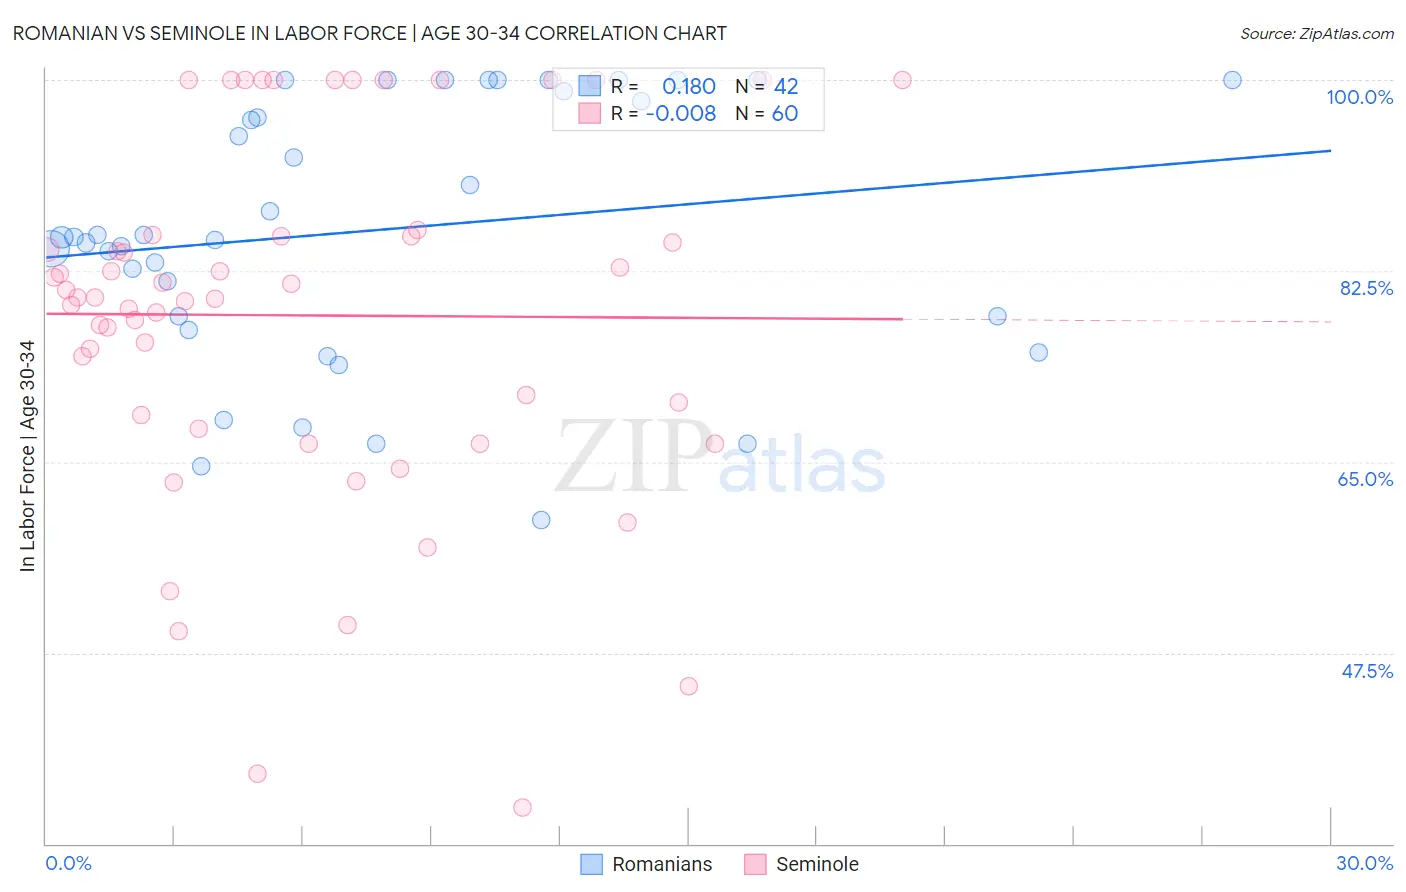
Romanian vs Seminole In Labor Force | Age 30-34 Correlation Chart
The statistical analysis conducted on geographies consisting of 377,700,007 people shows a poor positive correlation between the proportion of Romanians and labor force participation rate among population between the ages 30 and 34 in the United States with a correlation coefficient (R) of 0.180 and weighted average of 84.8%. Similarly, the statistical analysis conducted on geographies consisting of 118,296,286 people shows no correlation between the proportion of Seminole and labor force participation rate among population between the ages 30 and 34 in the United States with a correlation coefficient (R) of -0.008 and weighted average of 80.8%, a difference of 4.9%.
In Labor Force | Age 30-34 Correlation Summary
| Measurement | Romanian | Seminole |
| Minimum | 59.7% | 33.3% |
| Maximum | 100.0% | 100.0% |
| Range | 40.3% | 66.7% |
| Mean | 86.2% | 78.4% |
| Median | 85.6% | 80.0% |
| Interquartile 25% (IQ1) | 78.3% | 68.6% |
| Interquartile 75% (IQ3) | 99.0% | 85.7% |
| Interquartile Range (IQR) | 20.7% | 17.1% |
| Standard Deviation (Sample) | 11.9% | 16.5% |
| Standard Deviation (Population) | 11.7% | 16.3% |
Similar Demographics by In Labor Force | Age 30-34
Demographics Similar to Romanians by In Labor Force | Age 30-34
In terms of in labor force | age 30-34, the demographic groups most similar to Romanians are Immigrants from Senegal (84.8%, a difference of 0.0%), German (84.8%, a difference of 0.010%), Immigrants from Ukraine (84.8%, a difference of 0.020%), Immigrants from Saudi Arabia (84.9%, a difference of 0.030%), and Immigrants from Colombia (84.9%, a difference of 0.030%).
| Demographics | Rating | Rank | In Labor Force | Age 30-34 |
| Palestinians | 77.7 /100 | #145 | Good 84.9% |
| Immigrants | Saudi Arabia | 76.6 /100 | #146 | Good 84.9% |
| Immigrants | Colombia | 76.3 /100 | #147 | Good 84.9% |
| Immigrants | Pakistan | 76.2 /100 | #148 | Good 84.9% |
| Immigrants | Ukraine | 75.1 /100 | #149 | Good 84.8% |
| Germans | 75.1 /100 | #150 | Good 84.8% |
| Immigrants | Senegal | 74.0 /100 | #151 | Good 84.8% |
| Romanians | 73.5 /100 | #152 | Good 84.8% |
| Syrians | 70.1 /100 | #153 | Good 84.8% |
| Northern Europeans | 70.0 /100 | #154 | Good 84.8% |
| Immigrants | Sudan | 69.5 /100 | #155 | Good 84.8% |
| French Canadians | 67.3 /100 | #156 | Good 84.8% |
| Peruvians | 65.9 /100 | #157 | Good 84.8% |
| Immigrants | Armenia | 64.7 /100 | #158 | Good 84.8% |
| Czechoslovakians | 63.0 /100 | #159 | Good 84.8% |
Demographics Similar to Seminole by In Labor Force | Age 30-34
In terms of in labor force | age 30-34, the demographic groups most similar to Seminole are Colville (80.7%, a difference of 0.19%), Dutch West Indian (81.0%, a difference of 0.22%), Cheyenne (81.1%, a difference of 0.38%), Paiute (81.2%, a difference of 0.41%), and Puerto Rican (81.2%, a difference of 0.46%).
| Demographics | Rating | Rank | In Labor Force | Age 30-34 |
| Shoshone | 0.0 /100 | #319 | Tragic 81.4% |
| Yaqui | 0.0 /100 | #320 | Tragic 81.4% |
| Alaska Natives | 0.0 /100 | #321 | Tragic 81.3% |
| Puerto Ricans | 0.0 /100 | #322 | Tragic 81.2% |
| Paiute | 0.0 /100 | #323 | Tragic 81.2% |
| Cheyenne | 0.0 /100 | #324 | Tragic 81.1% |
| Dutch West Indians | 0.0 /100 | #325 | Tragic 81.0% |
| Seminole | 0.0 /100 | #326 | Tragic 80.8% |
| Colville | 0.0 /100 | #327 | Tragic 80.7% |
| Sioux | 0.0 /100 | #328 | Tragic 80.4% |
| Creek | 0.0 /100 | #329 | Tragic 80.4% |
| Pueblo | 0.0 /100 | #330 | Tragic 80.0% |
| Houma | 0.0 /100 | #331 | Tragic 79.9% |
| Kiowa | 0.0 /100 | #332 | Tragic 79.8% |
| Inupiat | 0.0 /100 | #333 | Tragic 79.7% |