Immigrants from Scotland vs English In Labor Force | Age 30-34
COMPARE
Immigrants from Scotland
English
In Labor Force | Age 30-34
In Labor Force | Age 30-34 Comparison
Immigrants from Scotland
English
85.1%
IN LABOR FORCE | AGE 30-34
94.9/ 100
METRIC RATING
111th/ 347
METRIC RANK
84.0%
IN LABOR FORCE | AGE 30-34
1.4/ 100
METRIC RATING
239th/ 347
METRIC RANK
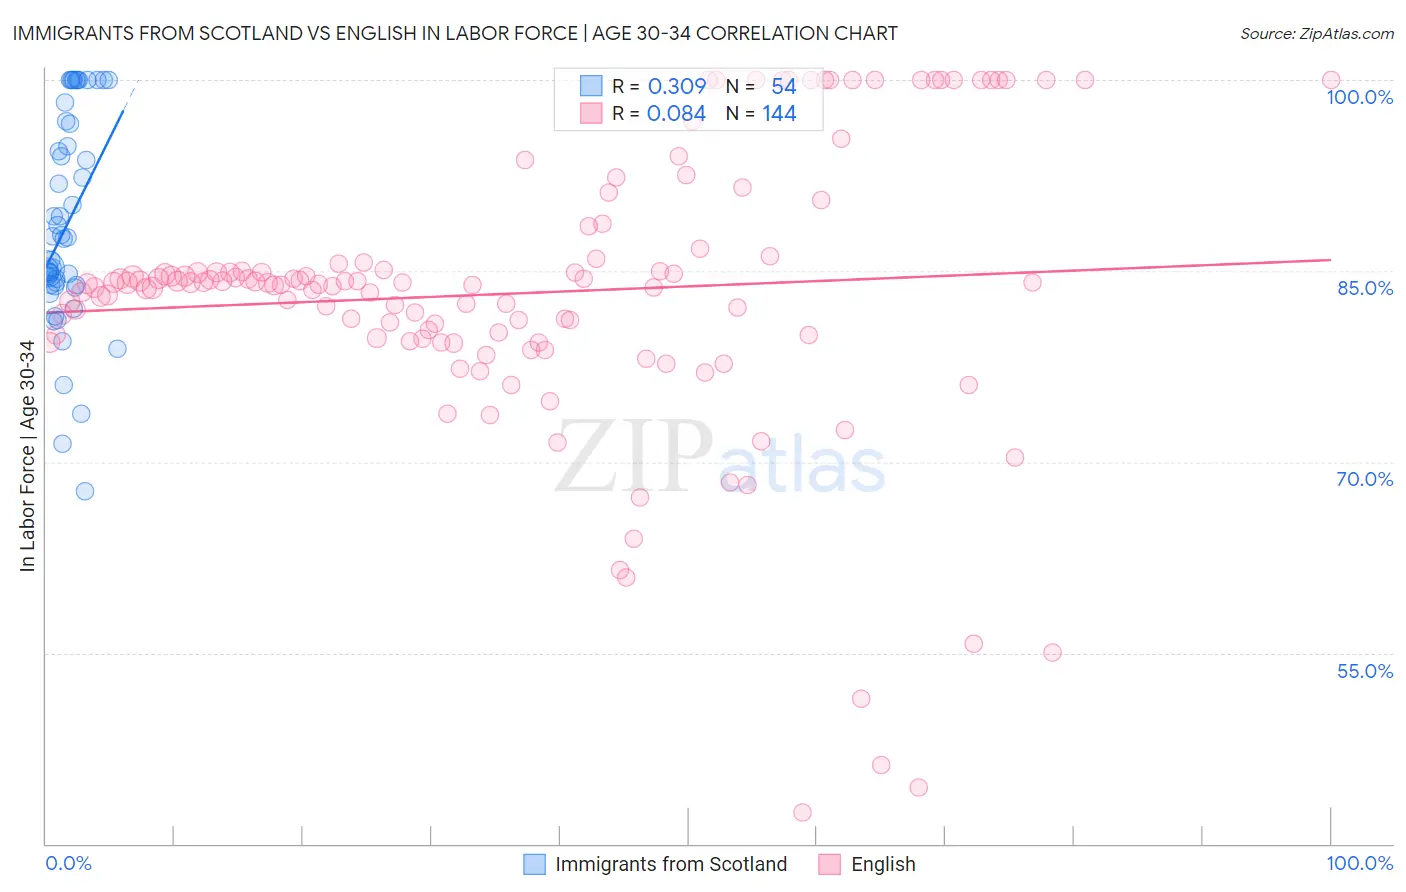
Immigrants from Scotland vs English In Labor Force | Age 30-34 Correlation Chart
The statistical analysis conducted on geographies consisting of 196,354,267 people shows a mild positive correlation between the proportion of Immigrants from Scotland and labor force participation rate among population between the ages 30 and 34 in the United States with a correlation coefficient (R) of 0.309 and weighted average of 85.1%. Similarly, the statistical analysis conducted on geographies consisting of 577,859,579 people shows a slight positive correlation between the proportion of English and labor force participation rate among population between the ages 30 and 34 in the United States with a correlation coefficient (R) of 0.084 and weighted average of 84.0%, a difference of 1.3%.
In Labor Force | Age 30-34 Correlation Summary
| Measurement | Immigrants from Scotland | English |
| Minimum | 67.7% | 42.5% |
| Maximum | 100.0% | 100.0% |
| Range | 32.3% | 57.5% |
| Mean | 88.6% | 83.2% |
| Median | 87.6% | 84.0% |
| Interquartile 25% (IQ1) | 83.9% | 79.7% |
| Interquartile 75% (IQ3) | 96.5% | 85.6% |
| Interquartile Range (IQR) | 12.7% | 5.9% |
| Standard Deviation (Sample) | 8.2% | 11.1% |
| Standard Deviation (Population) | 8.1% | 11.0% |
Similar Demographics by In Labor Force | Age 30-34
Demographics Similar to Immigrants from Scotland by In Labor Force | Age 30-34
In terms of in labor force | age 30-34, the demographic groups most similar to Immigrants from Scotland are Immigrants from Hungary (85.1%, a difference of 0.0%), Immigrants from Romania (85.1%, a difference of 0.010%), Yugoslavian (85.1%, a difference of 0.010%), Immigrants from South Central Asia (85.1%, a difference of 0.010%), and Egyptian (85.1%, a difference of 0.010%).
| Demographics | Rating | Rank | In Labor Force | Age 30-34 |
| Immigrants | Ghana | 96.5 /100 | #104 | Exceptional 85.2% |
| Alsatians | 96.3 /100 | #105 | Exceptional 85.2% |
| Immigrants | Middle Africa | 96.3 /100 | #106 | Exceptional 85.2% |
| Immigrants | Northern Africa | 96.3 /100 | #107 | Exceptional 85.2% |
| Immigrants | Zimbabwe | 95.8 /100 | #108 | Exceptional 85.1% |
| Argentineans | 95.8 /100 | #109 | Exceptional 85.1% |
| Immigrants | South Africa | 95.3 /100 | #110 | Exceptional 85.1% |
| Immigrants | Scotland | 94.9 /100 | #111 | Exceptional 85.1% |
| Immigrants | Hungary | 94.8 /100 | #112 | Exceptional 85.1% |
| Immigrants | Romania | 94.7 /100 | #113 | Exceptional 85.1% |
| Yugoslavians | 94.7 /100 | #114 | Exceptional 85.1% |
| Immigrants | South Central Asia | 94.6 /100 | #115 | Exceptional 85.1% |
| Egyptians | 94.5 /100 | #116 | Exceptional 85.1% |
| Immigrants | Denmark | 94.3 /100 | #117 | Exceptional 85.1% |
| Immigrants | Malaysia | 94.2 /100 | #118 | Exceptional 85.1% |
Demographics Similar to English by In Labor Force | Age 30-34
In terms of in labor force | age 30-34, the demographic groups most similar to English are Immigrants from Barbados (84.0%, a difference of 0.0%), Venezuelan (84.0%, a difference of 0.0%), Celtic (84.1%, a difference of 0.010%), U.S. Virgin Islander (84.1%, a difference of 0.020%), and Immigrants from Portugal (84.0%, a difference of 0.020%).
| Demographics | Rating | Rank | In Labor Force | Age 30-34 |
| Immigrants | Immigrants | 2.0 /100 | #232 | Tragic 84.1% |
| West Indians | 1.9 /100 | #233 | Tragic 84.1% |
| Haitians | 1.8 /100 | #234 | Tragic 84.1% |
| French American Indians | 1.7 /100 | #235 | Tragic 84.1% |
| U.S. Virgin Islanders | 1.5 /100 | #236 | Tragic 84.1% |
| Celtics | 1.4 /100 | #237 | Tragic 84.1% |
| Immigrants | Barbados | 1.4 /100 | #238 | Tragic 84.0% |
| English | 1.4 /100 | #239 | Tragic 84.0% |
| Venezuelans | 1.3 /100 | #240 | Tragic 84.0% |
| Immigrants | Portugal | 1.2 /100 | #241 | Tragic 84.0% |
| Immigrants | Oceania | 1.1 /100 | #242 | Tragic 84.0% |
| Immigrants | Caribbean | 1.1 /100 | #243 | Tragic 84.0% |
| Basques | 0.9 /100 | #244 | Tragic 84.0% |
| Immigrants | Venezuela | 0.9 /100 | #245 | Tragic 84.0% |
| Central Americans | 0.9 /100 | #246 | Tragic 84.0% |