Immigrants from Scotland vs Kiowa 10th Grade

COMPARE

Immigrants from Scotland
Race
Ancestry
AfghanAfricanAlaska NativeAlaskan AthabascanAlbanianAleutAlsatianAmericanApacheArabArapahoArgentineanArmenianAssyrian/Chaldean/SyriacAustralianAustrianBahamianBangladeshiBarbadianBasqueBelgianBelizeanBermudanBhutaneseBlackfeetBolivianBrazilianBritishBritish West IndianBulgarianBurmeseCajunCambodianCanadianCape VerdeanCarpatho RusynCelticCentral AmericanCentral American IndianCherokeeCheyenneChickasawChileanChineseChippewaChoctawColombianColvilleComancheCosta RicanCreeCreekCroatianCrowCubanCypriotCzechCzechoslovakianDanishDelawareDominicanDutchDutch West IndianEastern EuropeanEcuadorianEgyptianEnglishEstonianEthiopianEuropeanFijianFilipinoFinnishFrenchFrench American IndianFrench CanadianGermanGerman RussianGhanaianGreekGuamanian/ChamorroGuatemalanGuyaneseHaitianHmongHonduranHopiHoumaHungarianIcelanderIndian (Asian)IndonesianInupiatIranianIraqiIrishIroquoisIsraeliItalianJamaicanJapaneseJordanianKenyanKoreanLaotianLatvianLebaneseLiberianLithuanianLumbeeLuxembourgerMacedonianMalaysianMalteseMarshalleseMenomineeMexicanMexican American IndianMongolianMoroccanNative HawaiianNavajoNepaleseNew ZealanderNicaraguanNigerianNorthern EuropeanNorwegianOkinawanOsageOttawaPaiutePakistaniPalestinianPanamanianParaguayanPennsylvania GermanPeruvianPimaPolishPortuguesePotawatomiPuebloPuerto RicanPuget Sound SalishRomanianRussianSalvadoranSamoanScandinavianScotch-IrishScottishSeminoleSenegaleseSerbianShoshoneSierra LeoneanSiouxSlavicSlovakSloveneSomaliSouth AfricanSouth AmericanSouth American IndianSoviet UnionSpaniardSpanishSpanish AmericanSpanish American IndianSri LankanSubsaharan AfricanSudaneseSwedishSwissSyrianTaiwaneseThaiTlingit-HaidaTohono O'OdhamTonganTrinidadian and TobagonianTsimshianTurkishU.S. Virgin IslanderUgandanUkrainianUruguayanUteVenezuelanVietnameseWelshWest IndianYakamaYaquiYugoslavianYumanYup'ikZimbabwean
Immigration
NonimmigrantsImmigrantsAfghanistanAfricaAlbaniaArgentinaArmeniaAsiaAustraliaAustriaBahamasBangladeshBarbadosBelarusBelgiumBelizeBoliviaBosnia and HerzegovinaBrazilBulgariaBurma/MyanmarCabo VerdeCambodiaCameroonCanadaCaribbeanCentral AmericaChileChinaColombiaCongoCosta RicaCroatiaCubaCzechoslovakiaDenmarkDominicaDominican RepublicEastern AfricaEastern AsiaEastern EuropeEcuadorEgyptEl SalvadorEnglandEritreaEthiopiaEuropeFijiFranceGermanyGhanaGreeceGrenadaGuatemalaGuyanaHaitiHondurasHong KongHungaryIndiaIndonesiaIranIraqIrelandIsraelItalyJamaicaJapanJordanKazakhstanKenyaKoreaKuwaitLaosLatin AmericaLatviaLebanonLiberiaLithuaniaMalaysiaMexicoMicronesiaMiddle AfricaMoldovaMoroccoNepalNetherlandsNicaraguaNigeriaNorth AmericaNorth MacedoniaNorthern AfricaNorthern EuropeNorwayOceaniaPakistanPanamaPeruPhilippinesPolandPortugalRomaniaRussiaSaudi ArabiaScotlandSenegalSerbiaSierra LeoneSingaporeSomaliaSouth AfricaSouth AmericaSouth Central AsiaSouth Eastern AsiaSouthern EuropeSpainSri LankaSt. Vincent and the GrenadinesSudanSwedenSwitzerlandSyriaTaiwanThailandTrinidad and TobagoTurkeyUgandaUkraineUruguayUzbekistanVenezuelaVietnamWest IndiesWestern AfricaWestern AsiaWestern EuropeYemenZaireZimbabweAzores
Kiowa
Race
Ancestry
AfghanAfricanAlaska NativeAlaskan AthabascanAlbanianAleutAlsatianAmericanApacheArabArapahoArgentineanArmenianAssyrian/Chaldean/SyriacAustralianAustrianBahamianBangladeshiBarbadianBasqueBelgianBelizeanBermudanBhutaneseBlackfeetBolivianBrazilianBritishBritish West IndianBulgarianBurmeseCajunCambodianCanadianCape VerdeanCarpatho RusynCelticCentral AmericanCentral American IndianCherokeeCheyenneChickasawChileanChineseChippewaChoctawColombianColvilleComancheCosta RicanCreeCreekCroatianCrowCubanCypriotCzechCzechoslovakianDanishDelawareDominicanDutchDutch West IndianEastern EuropeanEcuadorianEgyptianEnglishEstonianEthiopianEuropeanFijianFilipinoFinnishFrenchFrench American IndianFrench CanadianGermanGerman RussianGhanaianGreekGuamanian/ChamorroGuatemalanGuyaneseHaitianHmongHonduranHopiHoumaHungarianIcelanderIndian (Asian)IndonesianInupiatIranianIraqiIrishIroquoisIsraeliItalianJamaicanJapaneseJordanianKenyanKiowaKoreanLaotianLatvianLebaneseLiberianLithuanianLumbeeLuxembourgerMacedonianMalaysianMalteseMarshalleseMenomineeMexicanMexican American IndianMongolianMoroccanNative HawaiianNavajoNepaleseNew ZealanderNicaraguanNigerianNorthern EuropeanNorwegianOkinawanOsageOttawaPaiutePakistaniPalestinianPanamanianParaguayanPennsylvania GermanPeruvianPimaPolishPortuguesePotawatomiPuebloPuerto RicanPuget Sound SalishRomanianRussianSalvadoranSamoanScandinavianScotch-IrishScottishSeminoleSenegaleseSerbianShoshoneSierra LeoneanSiouxSlavicSlovakSloveneSomaliSouth AfricanSouth AmericanSouth American IndianSoviet UnionSpaniardSpanishSpanish AmericanSpanish American IndianSri LankanSubsaharan AfricanSudaneseSwedishSwissSyrianTaiwaneseThaiTlingit-HaidaTohono O'OdhamTonganTrinidadian and TobagonianTsimshianTurkishU.S. Virgin IslanderUgandanUkrainianUruguayanUteVenezuelanVietnameseWelshWest IndianYakamaYaquiYugoslavianYumanYup'ikZimbabwean
Immigration
NonimmigrantsImmigrantsAfghanistanAfricaAlbaniaArgentinaArmeniaAsiaAustraliaAustriaBahamasBangladeshBarbadosBelarusBelgiumBelizeBoliviaBosnia and HerzegovinaBrazilBulgariaBurma/MyanmarCabo VerdeCambodiaCameroonCanadaCaribbeanCentral AmericaChileChinaColombiaCongoCosta RicaCroatiaCubaCzechoslovakiaDenmarkDominicaDominican RepublicEastern AfricaEastern AsiaEastern EuropeEcuadorEgyptEl SalvadorEnglandEritreaEthiopiaEuropeFijiFranceGermanyGhanaGreeceGrenadaGuatemalaGuyanaHaitiHondurasHong KongHungaryIndiaIndonesiaIranIraqIrelandIsraelItalyJamaicaJapanJordanKazakhstanKenyaKoreaKuwaitLaosLatin AmericaLatviaLebanonLiberiaLithuaniaMalaysiaMexicoMicronesiaMiddle AfricaMoldovaMoroccoNepalNetherlandsNicaraguaNigeriaNorth AmericaNorth MacedoniaNorthern AfricaNorthern EuropeNorwayOceaniaPakistanPanamaPeruPhilippinesPolandPortugalRomaniaRussiaSaudi ArabiaSenegalSerbiaSierra LeoneSingaporeSomaliaSouth AfricaSouth AmericaSouth Central AsiaSouth Eastern AsiaSouthern EuropeSpainSri LankaSt. Vincent and the GrenadinesSudanSwedenSwitzerlandSyriaTaiwanThailandTrinidad and TobagoTurkeyUgandaUkraineUruguayUzbekistanVenezuelaVietnamWest IndiesWestern AfricaWestern AsiaWestern EuropeYemenZaireZimbabweAzores
10th Grade
Income
Poverty
Unemployment
Labor Participation
Family Structure
Vehicle Availability
Education Level
Disability

10th Grade Comparison

Immigrants from Scotland

Kiowa

Exceptional
Good
95.2%
10TH GRADE
99.9/ 100
METRIC RATING
39th/ 347
METRIC RANK
93.9%
10TH GRADE
73.3/ 100
METRIC RATING
157th/ 347
METRIC RANK

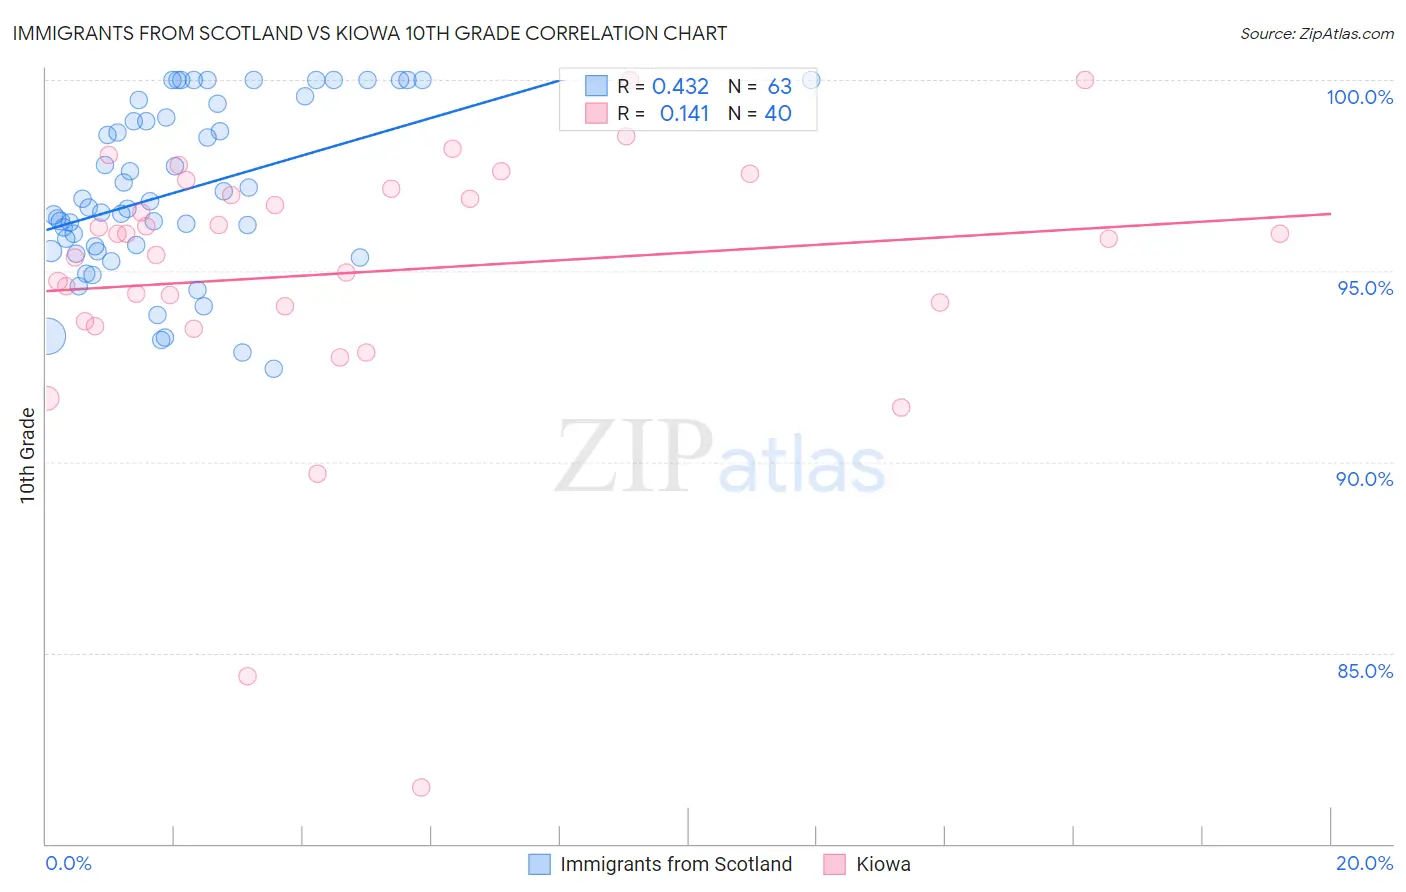
Immigrants from Scotland vs Kiowa 10th Grade Correlation Chart

The statistical analysis conducted on geographies consisting of 196,394,967 people shows a moderate positive correlation between the proportion of Immigrants from Scotland and percentage of population with at least 10th grade education in the United States with a correlation coefficient (R) of 0.432 and weighted average of 95.2%. Similarly, the statistical analysis conducted on geographies consisting of 56,101,759 people shows a poor positive correlation between the proportion of Kiowa and percentage of population with at least 10th grade education in the United States with a correlation coefficient (R) of 0.141 and weighted average of 93.9%, a difference of 1.4%.
Immigrants from Scotland vs Kiowa 10th Grade

10th Grade Correlation Summary

MeasurementImmigrants from ScotlandKiowa
Minimum92.4%81.5%
Maximum100.0%100.0%
Range7.6%18.5%
Mean97.1%95.0%
Median96.7%95.9%
Interquartile 25% (IQ1)95.5%93.9%
Interquartile 75% (IQ3)99.4%97.1%
Interquartile Range (IQR)3.8%3.2%
Standard Deviation (Sample)2.2%3.6%
Standard Deviation (Population)2.2%3.5%

Similar Demographics by 10th Grade

Demographics Similar to Immigrants from Scotland by 10th Grade

In terms of 10th grade, the demographic groups most similar to Immigrants from Scotland are Scotch-Irish (95.2%, a difference of 0.0%), Northern European (95.3%, a difference of 0.020%), Russian (95.2%, a difference of 0.030%), French Canadian (95.3%, a difference of 0.060%), and Slavic (95.2%, a difference of 0.060%).
DemographicsRating | Rank10th Grade
Hungarians
100.0
/100
|
#32
Exceptional
95.3%
French
100.0
/100
|
#33
Exceptional
95.3%
British
99.9
/100
|
#34
Exceptional
95.3%
Estonians
99.9
/100
|
#35
Exceptional
95.3%
Immigrants | India
99.9
/100
|
#36
Exceptional
95.3%
French Canadians
99.9
/100
|
#37
Exceptional
95.3%
Northern Europeans
99.9
/100
|
#38
Exceptional
95.3%
Immigrants | Scotland
99.9
/100
|
#39
Exceptional
95.2%
Scotch-Irish
99.9
/100
|
#40
Exceptional
95.2%
Russians
99.9
/100
|
#41
Exceptional
95.2%
Slavs
99.9
/100
|
#42
Exceptional
95.2%
Macedonians
99.9
/100
|
#43
Exceptional
95.2%
Immigrants | Northern Europe
99.9
/100
|
#44
Exceptional
95.2%
Greeks
99.9
/100
|
#45
Exceptional
95.2%
Czechoslovakians
99.9
/100
|
#46
Exceptional
95.1%

Demographics Similar to Kiowa by 10th Grade

In terms of 10th grade, the demographic groups most similar to Kiowa are Mongolian (94.0%, a difference of 0.010%), Immigrants from Kenya (94.0%, a difference of 0.020%), Spanish (94.0%, a difference of 0.020%), Immigrants from Brazil (94.0%, a difference of 0.030%), and Bermudan (93.9%, a difference of 0.030%).
DemographicsRating | Rank10th Grade
Egyptians
79.6
/100
|
#150
Good
94.0%
Kenyans
79.1
/100
|
#151
Good
94.0%
Immigrants | Italy
78.0
/100
|
#152
Good
94.0%
Immigrants | Brazil
75.5
/100
|
#153
Good
94.0%
Immigrants | Kenya
75.3
/100
|
#154
Good
94.0%
Spanish
74.9
/100
|
#155
Good
94.0%
Mongolians
74.4
/100
|
#156
Good
94.0%
Kiowa
73.3
/100
|
#157
Good
93.9%
Bermudans
71.0
/100
|
#158
Good
93.9%
Chileans
70.2
/100
|
#159
Good
93.9%
Pakistanis
70.1
/100
|
#160
Good
93.9%
Assyrians/Chaldeans/Syriacs
69.7
/100
|
#161
Good
93.9%
Immigrants | Poland
69.6
/100
|
#162
Good
93.9%
Venezuelans
69.5
/100
|
#163
Good
93.9%
Iraqis
68.1
/100
|
#164
Good
93.9%