Immigrants from Scotland vs Immigrants from El Salvador In Labor Force | Age 20-24
COMPARE
Immigrants from Scotland
Immigrants from El Salvador
In Labor Force | Age 20-24
In Labor Force | Age 20-24 Comparison
Immigrants from Scotland
Immigrants from El Salvador
75.8%
IN LABOR FORCE | AGE 20-24
93.7/ 100
METRIC RATING
125th/ 347
METRIC RANK
75.3%
IN LABOR FORCE | AGE 20-24
71.7/ 100
METRIC RATING
156th/ 347
METRIC RANK
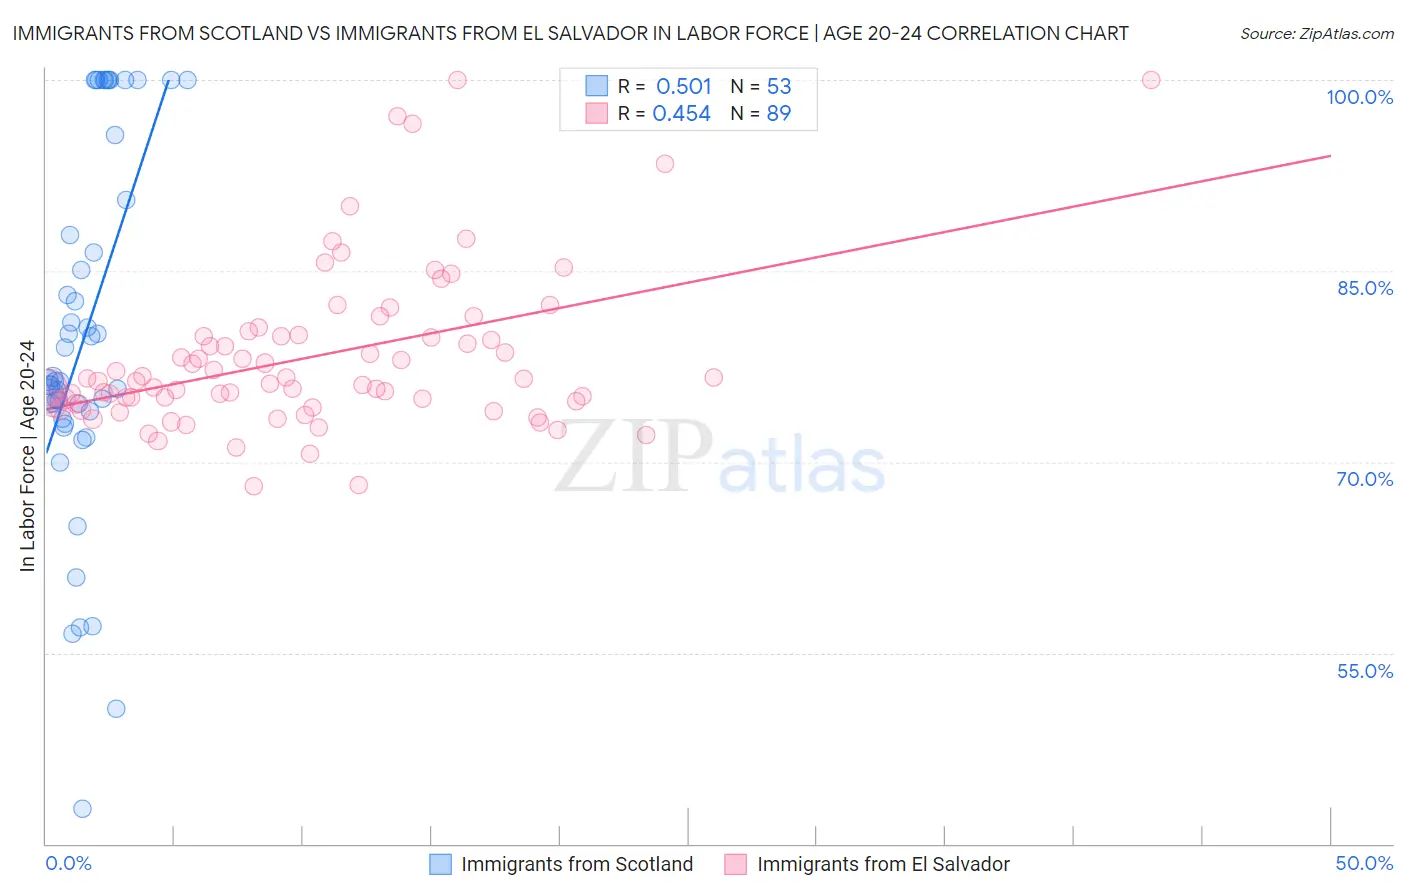
Immigrants from Scotland vs Immigrants from El Salvador In Labor Force | Age 20-24 Correlation Chart
The statistical analysis conducted on geographies consisting of 196,345,554 people shows a substantial positive correlation between the proportion of Immigrants from Scotland and labor force participation rate among population between the ages 20 and 24 in the United States with a correlation coefficient (R) of 0.501 and weighted average of 75.8%. Similarly, the statistical analysis conducted on geographies consisting of 357,704,995 people shows a moderate positive correlation between the proportion of Immigrants from El Salvador and labor force participation rate among population between the ages 20 and 24 in the United States with a correlation coefficient (R) of 0.454 and weighted average of 75.3%, a difference of 0.64%.
In Labor Force | Age 20-24 Correlation Summary
| Measurement | Immigrants from Scotland | Immigrants from El Salvador |
| Minimum | 42.7% | 68.1% |
| Maximum | 100.0% | 100.0% |
| Range | 57.3% | 31.9% |
| Mean | 80.1% | 78.3% |
| Median | 76.4% | 76.4% |
| Interquartile 25% (IQ1) | 73.7% | 74.5% |
| Interquartile 75% (IQ3) | 93.2% | 79.9% |
| Interquartile Range (IQR) | 19.5% | 5.4% |
| Standard Deviation (Sample) | 14.2% | 6.3% |
| Standard Deviation (Population) | 14.0% | 6.3% |
Similar Demographics by In Labor Force | Age 20-24
Demographics Similar to Immigrants from Scotland by In Labor Force | Age 20-24
In terms of in labor force | age 20-24, the demographic groups most similar to Immigrants from Scotland are Immigrants from Sierra Leone (75.8%, a difference of 0.010%), Pakistani (75.8%, a difference of 0.030%), Immigrants from Bulgaria (75.8%, a difference of 0.030%), Immigrants from Serbia (75.8%, a difference of 0.040%), and Brazilian (75.8%, a difference of 0.040%).
| Demographics | Rating | Rank | In Labor Force | Age 20-24 |
| Spanish Americans | 94.8 /100 | #118 | Exceptional 75.8% |
| Immigrants | Portugal | 94.8 /100 | #119 | Exceptional 75.8% |
| Immigrants | Africa | 94.6 /100 | #120 | Exceptional 75.8% |
| Immigrants | Serbia | 94.3 /100 | #121 | Exceptional 75.8% |
| Pakistanis | 94.1 /100 | #122 | Exceptional 75.8% |
| Immigrants | Bulgaria | 94.1 /100 | #123 | Exceptional 75.8% |
| Immigrants | Sierra Leone | 93.8 /100 | #124 | Exceptional 75.8% |
| Immigrants | Scotland | 93.7 /100 | #125 | Exceptional 75.8% |
| Brazilians | 93.0 /100 | #126 | Exceptional 75.8% |
| Sub-Saharan Africans | 90.9 /100 | #127 | Exceptional 75.7% |
| Immigrants | Afghanistan | 89.4 /100 | #128 | Excellent 75.6% |
| Iroquois | 89.1 /100 | #129 | Excellent 75.6% |
| Immigrants | Austria | 88.8 /100 | #130 | Excellent 75.6% |
| Immigrants | Jordan | 88.5 /100 | #131 | Excellent 75.6% |
| Palestinians | 88.4 /100 | #132 | Excellent 75.6% |
Demographics Similar to Immigrants from El Salvador by In Labor Force | Age 20-24
In terms of in labor force | age 20-24, the demographic groups most similar to Immigrants from El Salvador are Immigrants from Guatemala (75.3%, a difference of 0.0%), Immigrants from Western Europe (75.3%, a difference of 0.0%), Guatemalan (75.3%, a difference of 0.010%), Osage (75.3%, a difference of 0.010%), and Immigrants from Bolivia (75.3%, a difference of 0.010%).
| Demographics | Rating | Rank | In Labor Force | Age 20-24 |
| Ugandans | 76.1 /100 | #149 | Good 75.4% |
| Salvadorans | 74.8 /100 | #150 | Good 75.3% |
| Paiute | 74.1 /100 | #151 | Good 75.3% |
| Lebanese | 73.5 /100 | #152 | Good 75.3% |
| Guatemalans | 72.3 /100 | #153 | Good 75.3% |
| Osage | 72.3 /100 | #154 | Good 75.3% |
| Immigrants | Guatemala | 71.9 /100 | #155 | Good 75.3% |
| Immigrants | El Salvador | 71.7 /100 | #156 | Good 75.3% |
| Immigrants | Western Europe | 71.5 /100 | #157 | Good 75.3% |
| Immigrants | Bolivia | 71.0 /100 | #158 | Good 75.3% |
| South American Indians | 69.0 /100 | #159 | Good 75.3% |
| Japanese | 68.7 /100 | #160 | Good 75.3% |
| New Zealanders | 65.4 /100 | #161 | Good 75.2% |
| Immigrants | Romania | 64.6 /100 | #162 | Good 75.2% |
| Costa Ricans | 64.2 /100 | #163 | Good 75.2% |