Immigrants from Scotland vs Polish In Labor Force | Age 20-24
COMPARE
Immigrants from Scotland
Polish
In Labor Force | Age 20-24
In Labor Force | Age 20-24 Comparison
Immigrants from Scotland
Poles
75.8%
IN LABOR FORCE | AGE 20-24
93.7/ 100
METRIC RATING
125th/ 347
METRIC RANK
77.6%
IN LABOR FORCE | AGE 20-24
100.0/ 100
METRIC RATING
31st/ 347
METRIC RANK
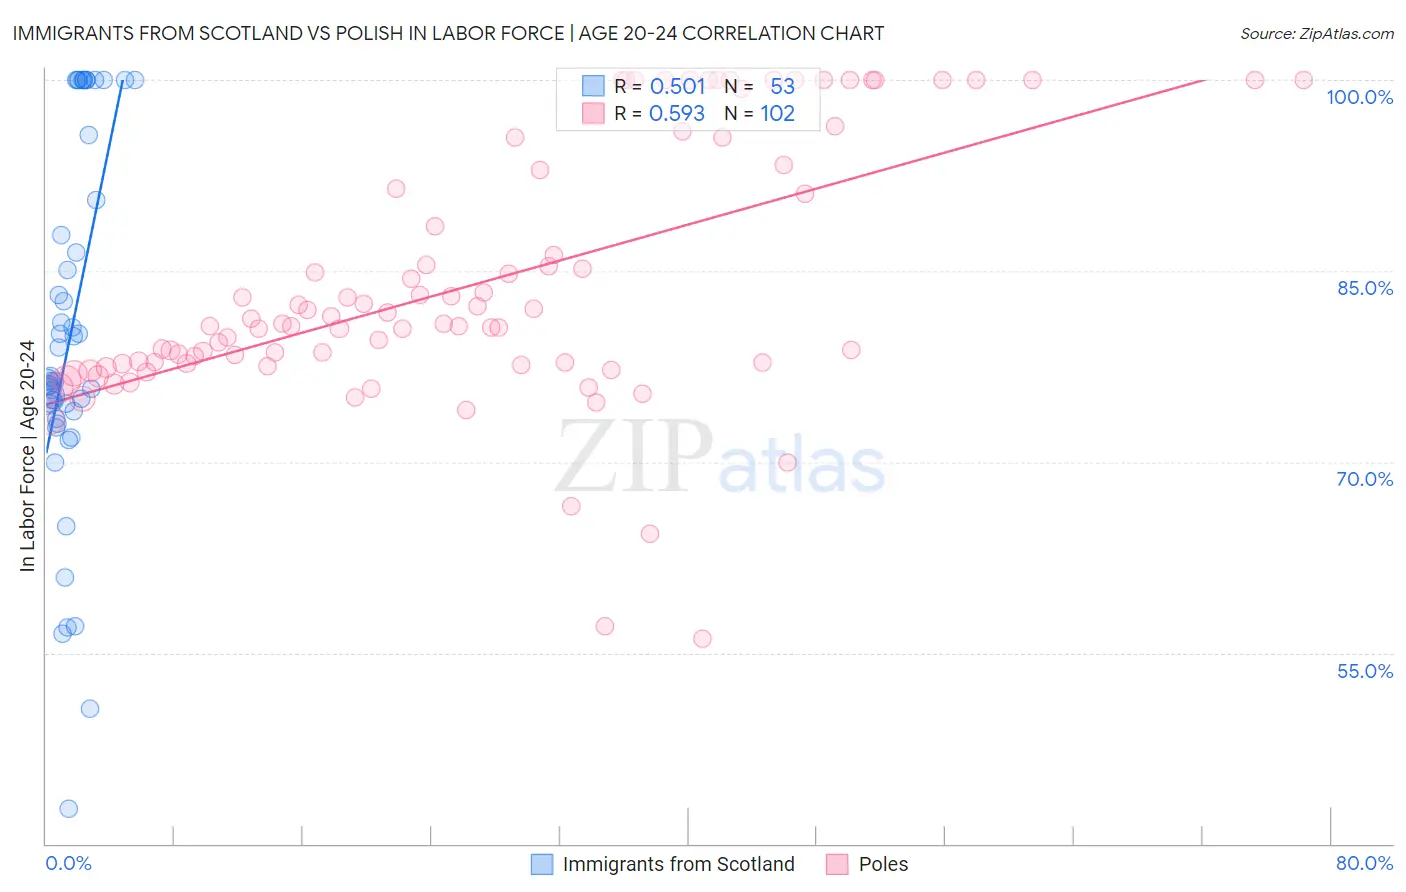
Immigrants from Scotland vs Polish In Labor Force | Age 20-24 Correlation Chart
The statistical analysis conducted on geographies consisting of 196,345,554 people shows a substantial positive correlation between the proportion of Immigrants from Scotland and labor force participation rate among population between the ages 20 and 24 in the United States with a correlation coefficient (R) of 0.501 and weighted average of 75.8%. Similarly, the statistical analysis conducted on geographies consisting of 559,319,488 people shows a substantial positive correlation between the proportion of Poles and labor force participation rate among population between the ages 20 and 24 in the United States with a correlation coefficient (R) of 0.593 and weighted average of 77.6%, a difference of 2.4%.
In Labor Force | Age 20-24 Correlation Summary
| Measurement | Immigrants from Scotland | Polish |
| Minimum | 42.7% | 56.1% |
| Maximum | 100.0% | 100.0% |
| Range | 57.3% | 43.9% |
| Mean | 80.1% | 83.9% |
| Median | 76.4% | 80.8% |
| Interquartile 25% (IQ1) | 73.7% | 77.7% |
| Interquartile 75% (IQ3) | 93.2% | 92.9% |
| Interquartile Range (IQR) | 19.5% | 15.2% |
| Standard Deviation (Sample) | 14.2% | 10.1% |
| Standard Deviation (Population) | 14.0% | 10.1% |
Similar Demographics by In Labor Force | Age 20-24
Demographics Similar to Immigrants from Scotland by In Labor Force | Age 20-24
In terms of in labor force | age 20-24, the demographic groups most similar to Immigrants from Scotland are Immigrants from Sierra Leone (75.8%, a difference of 0.010%), Pakistani (75.8%, a difference of 0.030%), Immigrants from Bulgaria (75.8%, a difference of 0.030%), Immigrants from Serbia (75.8%, a difference of 0.040%), and Brazilian (75.8%, a difference of 0.040%).
| Demographics | Rating | Rank | In Labor Force | Age 20-24 |
| Spanish Americans | 94.8 /100 | #118 | Exceptional 75.8% |
| Immigrants | Portugal | 94.8 /100 | #119 | Exceptional 75.8% |
| Immigrants | Africa | 94.6 /100 | #120 | Exceptional 75.8% |
| Immigrants | Serbia | 94.3 /100 | #121 | Exceptional 75.8% |
| Pakistanis | 94.1 /100 | #122 | Exceptional 75.8% |
| Immigrants | Bulgaria | 94.1 /100 | #123 | Exceptional 75.8% |
| Immigrants | Sierra Leone | 93.8 /100 | #124 | Exceptional 75.8% |
| Immigrants | Scotland | 93.7 /100 | #125 | Exceptional 75.8% |
| Brazilians | 93.0 /100 | #126 | Exceptional 75.8% |
| Sub-Saharan Africans | 90.9 /100 | #127 | Exceptional 75.7% |
| Immigrants | Afghanistan | 89.4 /100 | #128 | Excellent 75.6% |
| Iroquois | 89.1 /100 | #129 | Excellent 75.6% |
| Immigrants | Austria | 88.8 /100 | #130 | Excellent 75.6% |
| Immigrants | Jordan | 88.5 /100 | #131 | Excellent 75.6% |
| Palestinians | 88.4 /100 | #132 | Excellent 75.6% |
Demographics Similar to Poles by In Labor Force | Age 20-24
In terms of in labor force | age 20-24, the demographic groups most similar to Poles are English (77.6%, a difference of 0.060%), Immigrants from Ethiopia (77.5%, a difference of 0.11%), Swiss (77.7%, a difference of 0.12%), German Russian (77.5%, a difference of 0.12%), and Immigrants from Eastern Africa (77.5%, a difference of 0.13%).
| Demographics | Rating | Rank | In Labor Force | Age 20-24 |
| Liberians | 100.0 /100 | #24 | Exceptional 78.0% |
| Tlingit-Haida | 100.0 /100 | #25 | Exceptional 77.9% |
| Tongans | 100.0 /100 | #26 | Exceptional 77.9% |
| Immigrants | Micronesia | 100.0 /100 | #27 | Exceptional 77.8% |
| Belgians | 100.0 /100 | #28 | Exceptional 77.8% |
| Slovaks | 100.0 /100 | #29 | Exceptional 77.7% |
| Swiss | 100.0 /100 | #30 | Exceptional 77.7% |
| Poles | 100.0 /100 | #31 | Exceptional 77.6% |
| English | 100.0 /100 | #32 | Exceptional 77.6% |
| Immigrants | Ethiopia | 100.0 /100 | #33 | Exceptional 77.5% |
| German Russians | 100.0 /100 | #34 | Exceptional 77.5% |
| Immigrants | Eastern Africa | 100.0 /100 | #35 | Exceptional 77.5% |
| Welsh | 100.0 /100 | #36 | Exceptional 77.5% |
| Czechoslovakians | 100.0 /100 | #37 | Exceptional 77.5% |
| Marshallese | 100.0 /100 | #38 | Exceptional 77.4% |