Immigrants from Saudi Arabia vs Soviet Union In Labor Force | Age 16-19
COMPARE
Immigrants from Saudi Arabia
Soviet Union
In Labor Force | Age 16-19
In Labor Force | Age 16-19 Comparison
Immigrants from Saudi Arabia
Soviet Union
37.0%
IN LABOR FORCE | AGE 16-19
73.9/ 100
METRIC RATING
160th/ 347
METRIC RANK
31.4%
IN LABOR FORCE | AGE 16-19
0.0/ 100
METRIC RATING
319th/ 347
METRIC RANK
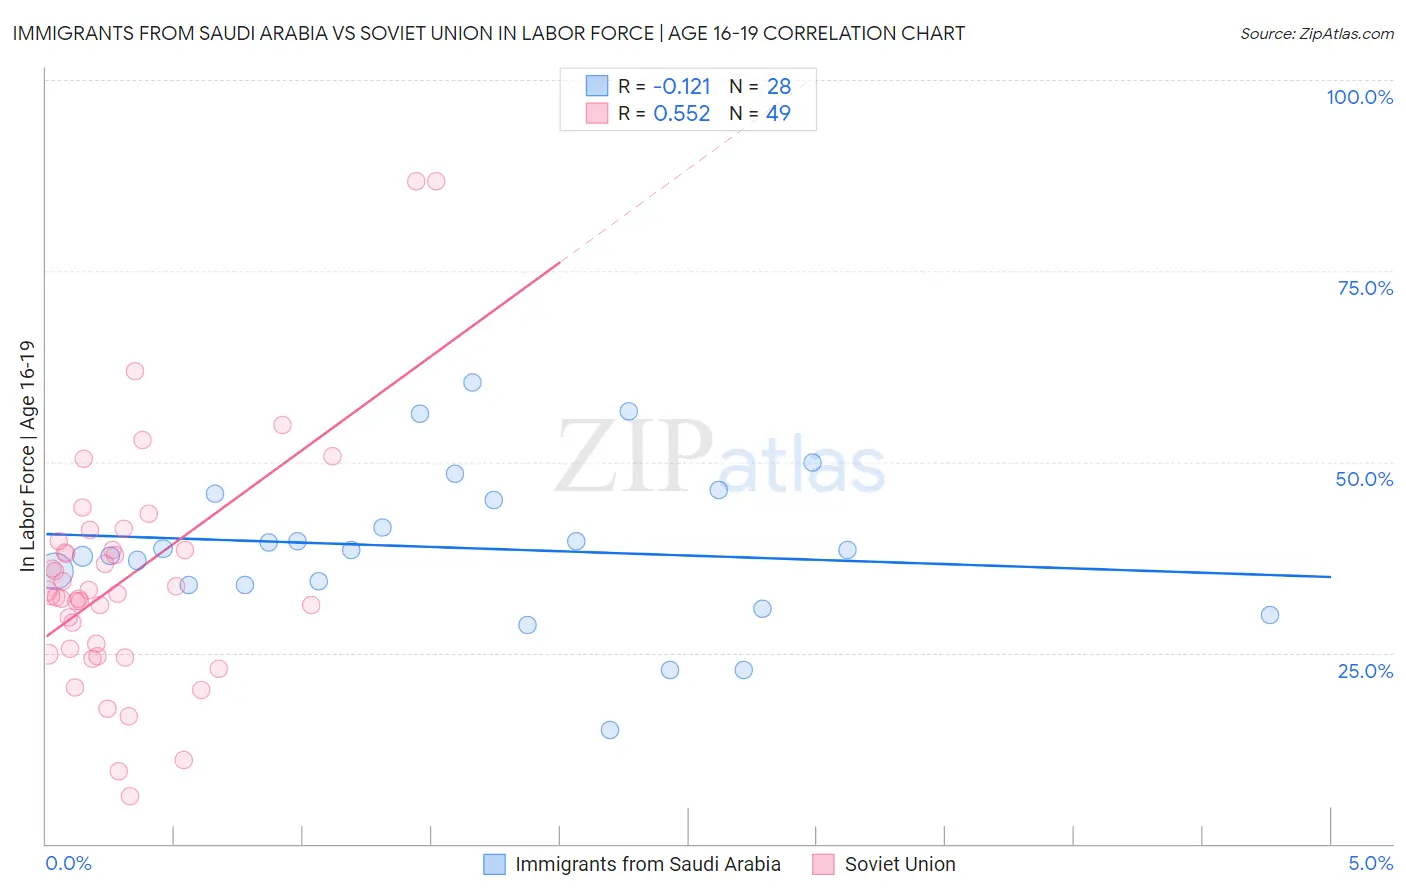
Immigrants from Saudi Arabia vs Soviet Union In Labor Force | Age 16-19 Correlation Chart
The statistical analysis conducted on geographies consisting of 164,246,290 people shows a poor negative correlation between the proportion of Immigrants from Saudi Arabia and labor force participation rate among population between the ages 16 and 19 in the United States with a correlation coefficient (R) of -0.121 and weighted average of 37.0%. Similarly, the statistical analysis conducted on geographies consisting of 43,506,709 people shows a substantial positive correlation between the proportion of Soviet Union and labor force participation rate among population between the ages 16 and 19 in the United States with a correlation coefficient (R) of 0.552 and weighted average of 31.4%, a difference of 17.9%.
In Labor Force | Age 16-19 Correlation Summary
| Measurement | Immigrants from Saudi Arabia | Soviet Union |
| Minimum | 14.9% | 6.3% |
| Maximum | 60.4% | 86.7% |
| Range | 45.5% | 80.4% |
| Mean | 38.7% | 34.8% |
| Median | 38.5% | 32.7% |
| Interquartile 25% (IQ1) | 33.9% | 25.2% |
| Interquartile 75% (IQ3) | 45.4% | 39.1% |
| Interquartile Range (IQR) | 11.6% | 13.9% |
| Standard Deviation (Sample) | 10.3% | 15.5% |
| Standard Deviation (Population) | 10.1% | 15.4% |
Similar Demographics by In Labor Force | Age 16-19
Demographics Similar to Immigrants from Saudi Arabia by In Labor Force | Age 16-19
In terms of in labor force | age 16-19, the demographic groups most similar to Immigrants from Saudi Arabia are Yaqui (37.1%, a difference of 0.030%), Ute (37.1%, a difference of 0.12%), Cambodian (37.0%, a difference of 0.15%), Immigrants from Brazil (37.1%, a difference of 0.17%), and Immigrants from Jordan (36.9%, a difference of 0.27%).
| Demographics | Rating | Rank | In Labor Force | Age 16-19 |
| Arapaho | 81.8 /100 | #153 | Excellent 37.3% |
| Immigrants | Bulgaria | 81.6 /100 | #154 | Excellent 37.3% |
| Immigrants | Lithuania | 80.7 /100 | #155 | Excellent 37.2% |
| Kiowa | 80.4 /100 | #156 | Excellent 37.2% |
| Immigrants | Brazil | 76.5 /100 | #157 | Good 37.1% |
| Ute | 75.7 /100 | #158 | Good 37.1% |
| Yaqui | 74.4 /100 | #159 | Good 37.1% |
| Immigrants | Saudi Arabia | 73.9 /100 | #160 | Good 37.0% |
| Cambodians | 71.5 /100 | #161 | Good 37.0% |
| Immigrants | Jordan | 69.5 /100 | #162 | Good 36.9% |
| Bermudans | 69.3 /100 | #163 | Good 36.9% |
| Immigrants | Kuwait | 68.9 /100 | #164 | Good 36.9% |
| Yakama | 66.9 /100 | #165 | Good 36.9% |
| Immigrants | Western Africa | 66.7 /100 | #166 | Good 36.9% |
| Arabs | 63.6 /100 | #167 | Good 36.8% |
Demographics Similar to Soviet Union by In Labor Force | Age 16-19
In terms of in labor force | age 16-19, the demographic groups most similar to Soviet Union are Ecuadorian (31.4%, a difference of 0.060%), West Indian (31.3%, a difference of 0.30%), Immigrants from Yemen (31.5%, a difference of 0.32%), Tohono O'odham (31.3%, a difference of 0.41%), and Immigrants from Caribbean (31.2%, a difference of 0.54%).
| Demographics | Rating | Rank | In Labor Force | Age 16-19 |
| Immigrants | Belize | 0.0 /100 | #312 | Tragic 31.8% |
| Hopi | 0.0 /100 | #313 | Tragic 31.8% |
| Cubans | 0.0 /100 | #314 | Tragic 31.8% |
| Immigrants | West Indies | 0.0 /100 | #315 | Tragic 31.7% |
| Filipinos | 0.0 /100 | #316 | Tragic 31.7% |
| Immigrants | Nicaragua | 0.0 /100 | #317 | Tragic 31.6% |
| Immigrants | Yemen | 0.0 /100 | #318 | Tragic 31.5% |
| Soviet Union | 0.0 /100 | #319 | Tragic 31.4% |
| Ecuadorians | 0.0 /100 | #320 | Tragic 31.4% |
| West Indians | 0.0 /100 | #321 | Tragic 31.3% |
| Tohono O'odham | 0.0 /100 | #322 | Tragic 31.3% |
| Immigrants | Caribbean | 0.0 /100 | #323 | Tragic 31.2% |
| Dominicans | 0.0 /100 | #324 | Tragic 31.2% |
| Immigrants | China | 0.0 /100 | #325 | Tragic 31.1% |
| Immigrants | Dominican Republic | 0.0 /100 | #326 | Tragic 31.1% |