Immigrants from Saudi Arabia vs Dominican In Labor Force | Age 16-19
COMPARE
Immigrants from Saudi Arabia
Dominican
In Labor Force | Age 16-19
In Labor Force | Age 16-19 Comparison
Immigrants from Saudi Arabia
Dominicans
37.0%
IN LABOR FORCE | AGE 16-19
73.9/ 100
METRIC RATING
160th/ 347
METRIC RANK
31.2%
IN LABOR FORCE | AGE 16-19
0.0/ 100
METRIC RATING
324th/ 347
METRIC RANK
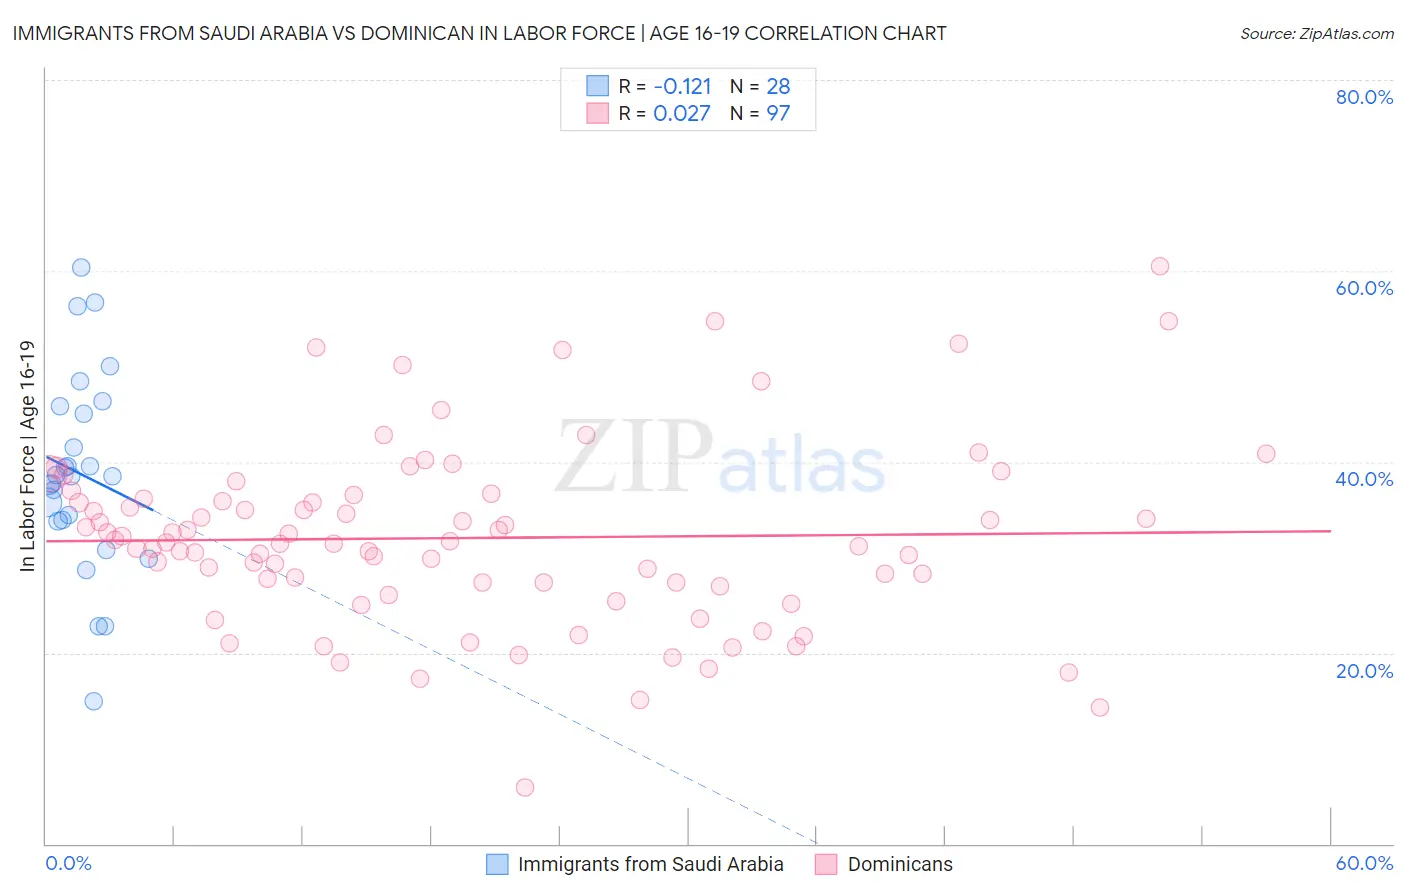
Immigrants from Saudi Arabia vs Dominican In Labor Force | Age 16-19 Correlation Chart
The statistical analysis conducted on geographies consisting of 164,246,290 people shows a poor negative correlation between the proportion of Immigrants from Saudi Arabia and labor force participation rate among population between the ages 16 and 19 in the United States with a correlation coefficient (R) of -0.121 and weighted average of 37.0%. Similarly, the statistical analysis conducted on geographies consisting of 354,586,301 people shows no correlation between the proportion of Dominicans and labor force participation rate among population between the ages 16 and 19 in the United States with a correlation coefficient (R) of 0.027 and weighted average of 31.2%, a difference of 18.8%.
In Labor Force | Age 16-19 Correlation Summary
| Measurement | Immigrants from Saudi Arabia | Dominican |
| Minimum | 14.9% | 5.9% |
| Maximum | 60.4% | 60.5% |
| Range | 45.5% | 54.6% |
| Mean | 38.7% | 32.0% |
| Median | 38.5% | 31.6% |
| Interquartile 25% (IQ1) | 33.9% | 27.2% |
| Interquartile 75% (IQ3) | 45.4% | 36.3% |
| Interquartile Range (IQR) | 11.6% | 9.2% |
| Standard Deviation (Sample) | 10.3% | 9.5% |
| Standard Deviation (Population) | 10.1% | 9.4% |
Similar Demographics by In Labor Force | Age 16-19
Demographics Similar to Immigrants from Saudi Arabia by In Labor Force | Age 16-19
In terms of in labor force | age 16-19, the demographic groups most similar to Immigrants from Saudi Arabia are Yaqui (37.1%, a difference of 0.030%), Ute (37.1%, a difference of 0.12%), Cambodian (37.0%, a difference of 0.15%), Immigrants from Brazil (37.1%, a difference of 0.17%), and Immigrants from Jordan (36.9%, a difference of 0.27%).
| Demographics | Rating | Rank | In Labor Force | Age 16-19 |
| Arapaho | 81.8 /100 | #153 | Excellent 37.3% |
| Immigrants | Bulgaria | 81.6 /100 | #154 | Excellent 37.3% |
| Immigrants | Lithuania | 80.7 /100 | #155 | Excellent 37.2% |
| Kiowa | 80.4 /100 | #156 | Excellent 37.2% |
| Immigrants | Brazil | 76.5 /100 | #157 | Good 37.1% |
| Ute | 75.7 /100 | #158 | Good 37.1% |
| Yaqui | 74.4 /100 | #159 | Good 37.1% |
| Immigrants | Saudi Arabia | 73.9 /100 | #160 | Good 37.0% |
| Cambodians | 71.5 /100 | #161 | Good 37.0% |
| Immigrants | Jordan | 69.5 /100 | #162 | Good 36.9% |
| Bermudans | 69.3 /100 | #163 | Good 36.9% |
| Immigrants | Kuwait | 68.9 /100 | #164 | Good 36.9% |
| Yakama | 66.9 /100 | #165 | Good 36.9% |
| Immigrants | Western Africa | 66.7 /100 | #166 | Good 36.9% |
| Arabs | 63.6 /100 | #167 | Good 36.8% |
Demographics Similar to Dominicans by In Labor Force | Age 16-19
In terms of in labor force | age 16-19, the demographic groups most similar to Dominicans are Immigrants from China (31.1%, a difference of 0.15%), Immigrants from Caribbean (31.2%, a difference of 0.18%), Tohono O'odham (31.3%, a difference of 0.31%), Immigrants from Dominican Republic (31.1%, a difference of 0.35%), and West Indian (31.3%, a difference of 0.43%).
| Demographics | Rating | Rank | In Labor Force | Age 16-19 |
| Immigrants | Nicaragua | 0.0 /100 | #317 | Tragic 31.6% |
| Immigrants | Yemen | 0.0 /100 | #318 | Tragic 31.5% |
| Soviet Union | 0.0 /100 | #319 | Tragic 31.4% |
| Ecuadorians | 0.0 /100 | #320 | Tragic 31.4% |
| West Indians | 0.0 /100 | #321 | Tragic 31.3% |
| Tohono O'odham | 0.0 /100 | #322 | Tragic 31.3% |
| Immigrants | Caribbean | 0.0 /100 | #323 | Tragic 31.2% |
| Dominicans | 0.0 /100 | #324 | Tragic 31.2% |
| Immigrants | China | 0.0 /100 | #325 | Tragic 31.1% |
| Immigrants | Dominican Republic | 0.0 /100 | #326 | Tragic 31.1% |
| Immigrants | Taiwan | 0.0 /100 | #327 | Tragic 31.0% |
| Immigrants | Ecuador | 0.0 /100 | #328 | Tragic 31.0% |
| Barbadians | 0.0 /100 | #329 | Tragic 31.0% |
| Lumbee | 0.0 /100 | #330 | Tragic 31.0% |
| Trinidadians and Tobagonians | 0.0 /100 | #331 | Tragic 30.9% |