Immigrants from Saudi Arabia vs Puget Sound Salish Child Poverty Among Boys Under 16
COMPARE
Immigrants from Saudi Arabia
Puget Sound Salish
Child Poverty Among Boys Under 16
Child Poverty Among Boys Under 16 Comparison
Immigrants from Saudi Arabia
Puget Sound Salish
16.4%
CHILD POVERTY AMONG BOYS UNDER 16
53.6/ 100
METRIC RATING
169th/ 347
METRIC RANK
15.8%
CHILD POVERTY AMONG BOYS UNDER 16
79.8/ 100
METRIC RATING
151st/ 347
METRIC RANK
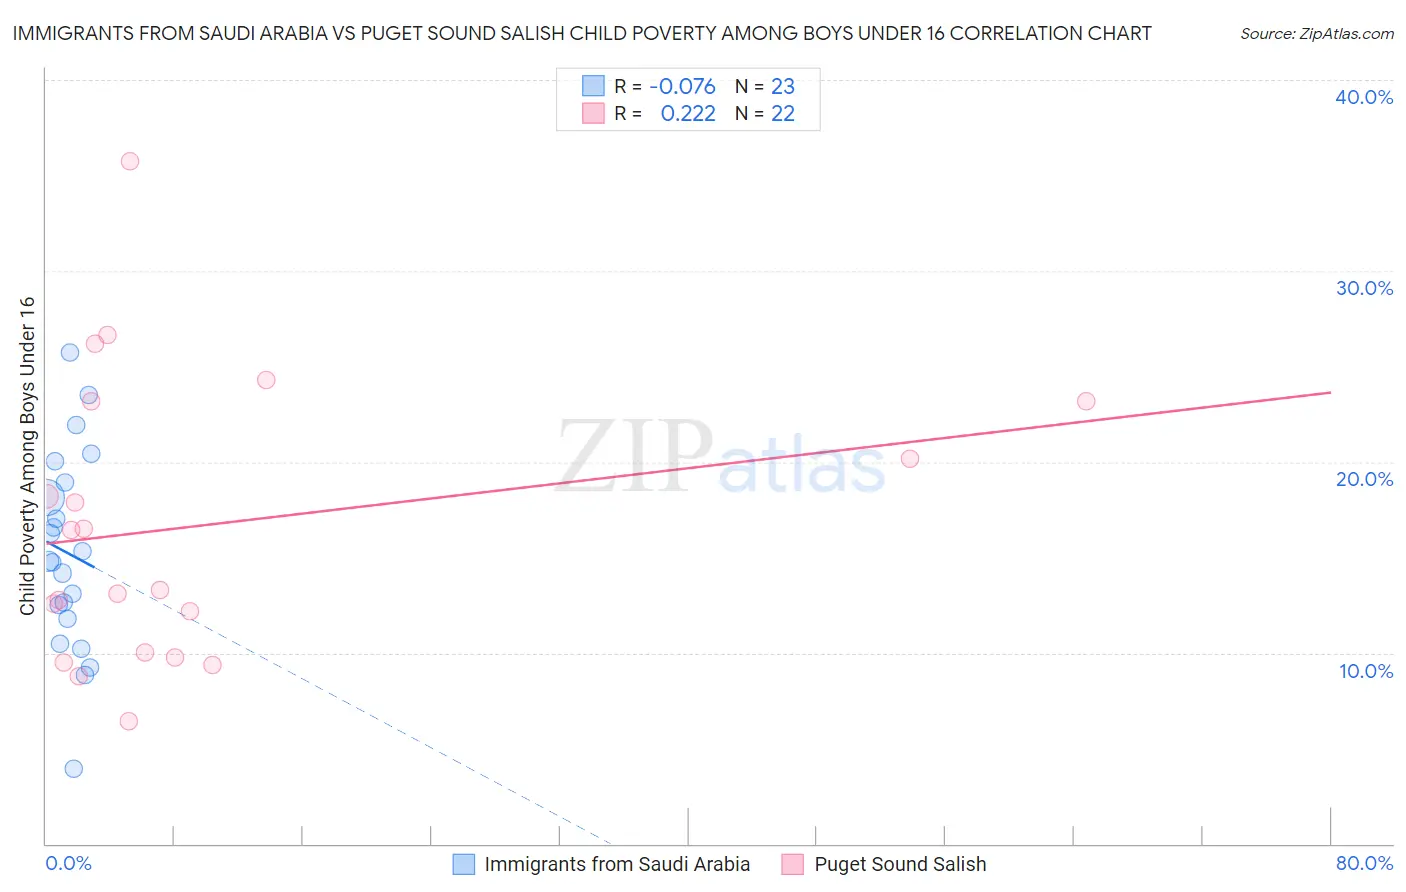
Immigrants from Saudi Arabia vs Puget Sound Salish Child Poverty Among Boys Under 16 Correlation Chart
The statistical analysis conducted on geographies consisting of 163,294,532 people shows a slight negative correlation between the proportion of Immigrants from Saudi Arabia and poverty level among boys under the age of 16 in the United States with a correlation coefficient (R) of -0.076 and weighted average of 16.4%. Similarly, the statistical analysis conducted on geographies consisting of 45,876,308 people shows a weak positive correlation between the proportion of Puget Sound Salish and poverty level among boys under the age of 16 in the United States with a correlation coefficient (R) of 0.222 and weighted average of 15.8%, a difference of 3.6%.
Child Poverty Among Boys Under 16 Correlation Summary
| Measurement | Immigrants from Saudi Arabia | Puget Sound Salish |
| Minimum | 3.9% | 6.4% |
| Maximum | 25.7% | 35.8% |
| Range | 21.8% | 29.3% |
| Mean | 15.2% | 16.6% |
| Median | 14.8% | 14.8% |
| Interquartile 25% (IQ1) | 11.8% | 10.0% |
| Interquartile 75% (IQ3) | 18.9% | 23.2% |
| Interquartile Range (IQR) | 7.1% | 13.2% |
| Standard Deviation (Sample) | 5.2% | 7.4% |
| Standard Deviation (Population) | 5.1% | 7.2% |
Demographics Similar to Immigrants from Saudi Arabia and Puget Sound Salish by Child Poverty Among Boys Under 16
In terms of child poverty among boys under 16, the demographic groups most similar to Immigrants from Saudi Arabia are South American (16.3%, a difference of 0.19%), Afghan (16.3%, a difference of 0.20%), Immigrants from Bosnia and Herzegovina (16.4%, a difference of 0.21%), Immigrants from Germany (16.2%, a difference of 1.2%), and Colombian (16.1%, a difference of 1.4%). Similarly, the demographic groups most similar to Puget Sound Salish are Immigrants from Venezuela (15.8%, a difference of 0.050%), Immigrants from Jordan (15.8%, a difference of 0.080%), French (15.8%, a difference of 0.19%), Syrian (15.9%, a difference of 0.39%), and French Canadian (15.9%, a difference of 0.54%).
| Demographics | Rating | Rank | Child Poverty Among Boys Under 16 |
| Immigrants | Jordan | 80.2 /100 | #150 | Excellent 15.8% |
| Puget Sound Salish | 79.8 /100 | #151 | Good 15.8% |
| Immigrants | Venezuela | 79.5 /100 | #152 | Good 15.8% |
| French | 78.7 /100 | #153 | Good 15.8% |
| Syrians | 77.5 /100 | #154 | Good 15.9% |
| French Canadians | 76.6 /100 | #155 | Good 15.9% |
| Israelis | 76.5 /100 | #156 | Good 15.9% |
| Immigrants | Nepal | 76.0 /100 | #157 | Good 15.9% |
| Yugoslavians | 75.9 /100 | #158 | Good 15.9% |
| Immigrants | Chile | 74.8 /100 | #159 | Good 15.9% |
| Immigrants | Northern Africa | 71.3 /100 | #160 | Good 16.0% |
| Immigrants | Oceania | 71.3 /100 | #161 | Good 16.0% |
| Guamanians/Chamorros | 69.6 /100 | #162 | Good 16.1% |
| Costa Ricans | 68.1 /100 | #163 | Good 16.1% |
| Immigrants | Albania | 67.9 /100 | #164 | Good 16.1% |
| Colombians | 65.2 /100 | #165 | Good 16.1% |
| Immigrants | Germany | 63.6 /100 | #166 | Good 16.2% |
| Afghans | 55.4 /100 | #167 | Average 16.3% |
| South Americans | 55.3 /100 | #168 | Average 16.3% |
| Immigrants | Saudi Arabia | 53.6 /100 | #169 | Average 16.4% |
| Immigrants | Bosnia and Herzegovina | 51.7 /100 | #170 | Average 16.4% |