Immigrants from Saudi Arabia vs Immigrants from Morocco In Labor Force | Age 16-19
COMPARE
Immigrants from Saudi Arabia
Immigrants from Morocco
In Labor Force | Age 16-19
In Labor Force | Age 16-19 Comparison
Immigrants from Saudi Arabia
Immigrants from Morocco
37.0%
IN LABOR FORCE | AGE 16-19
73.9/ 100
METRIC RATING
160th/ 347
METRIC RANK
36.4%
IN LABOR FORCE | AGE 16-19
41.1/ 100
METRIC RATING
180th/ 347
METRIC RANK
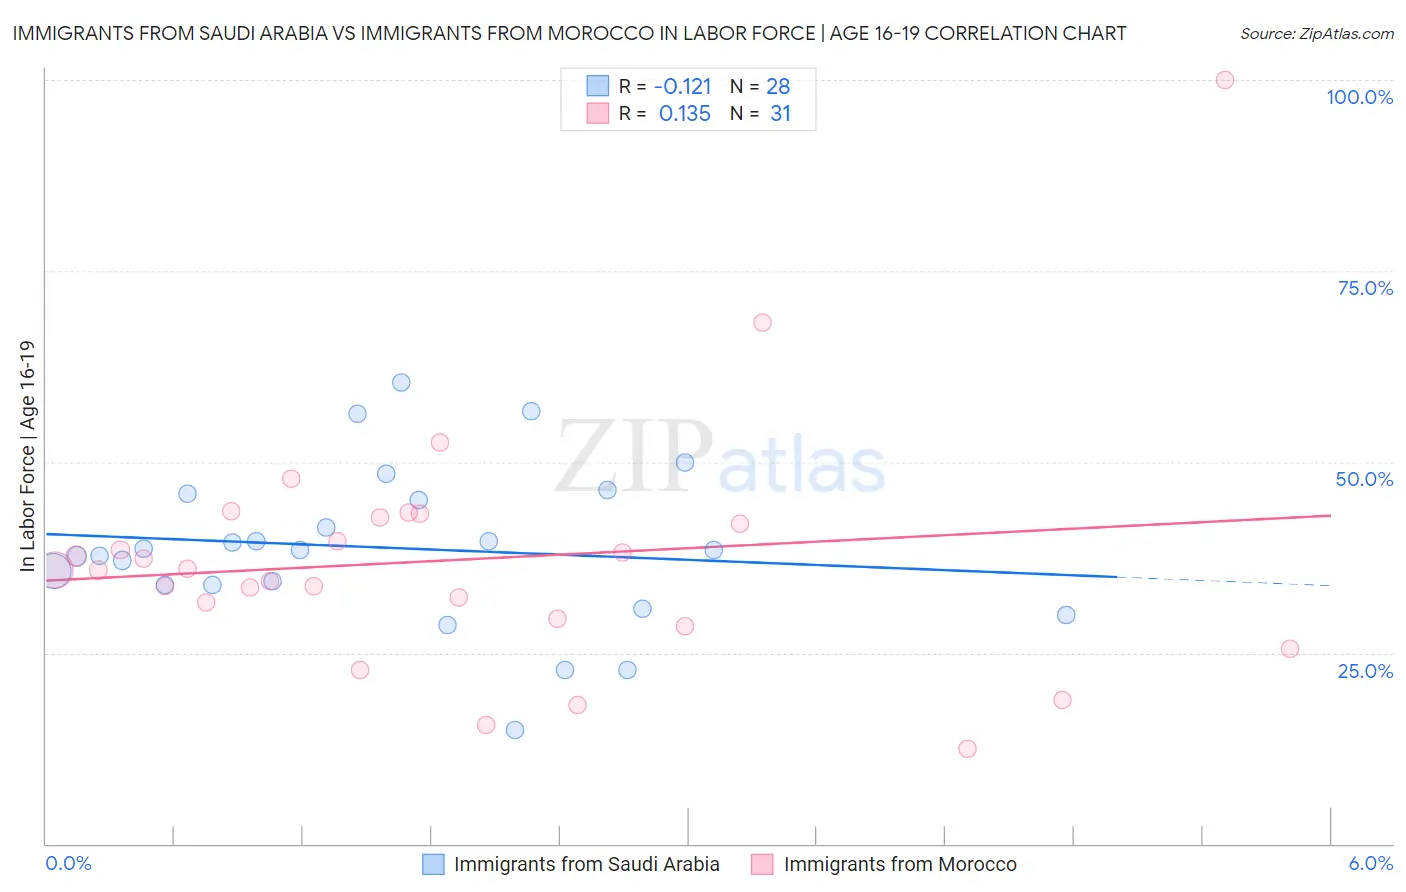
Immigrants from Saudi Arabia vs Immigrants from Morocco In Labor Force | Age 16-19 Correlation Chart
The statistical analysis conducted on geographies consisting of 164,246,290 people shows a poor negative correlation between the proportion of Immigrants from Saudi Arabia and labor force participation rate among population between the ages 16 and 19 in the United States with a correlation coefficient (R) of -0.121 and weighted average of 37.0%. Similarly, the statistical analysis conducted on geographies consisting of 178,800,996 people shows a poor positive correlation between the proportion of Immigrants from Morocco and labor force participation rate among population between the ages 16 and 19 in the United States with a correlation coefficient (R) of 0.135 and weighted average of 36.4%, a difference of 1.8%.
In Labor Force | Age 16-19 Correlation Summary
| Measurement | Immigrants from Saudi Arabia | Immigrants from Morocco |
| Minimum | 14.9% | 12.5% |
| Maximum | 60.4% | 100.0% |
| Range | 45.5% | 87.5% |
| Mean | 38.7% | 37.2% |
| Median | 38.5% | 35.9% |
| Interquartile 25% (IQ1) | 33.9% | 29.4% |
| Interquartile 75% (IQ3) | 45.4% | 42.6% |
| Interquartile Range (IQR) | 11.6% | 13.2% |
| Standard Deviation (Sample) | 10.3% | 16.1% |
| Standard Deviation (Population) | 10.1% | 15.9% |
Demographics Similar to Immigrants from Saudi Arabia and Immigrants from Morocco by In Labor Force | Age 16-19
In terms of in labor force | age 16-19, the demographic groups most similar to Immigrants from Saudi Arabia are Cambodian (37.0%, a difference of 0.15%), Immigrants from Jordan (36.9%, a difference of 0.27%), Bermudan (36.9%, a difference of 0.28%), Immigrants from Kuwait (36.9%, a difference of 0.31%), and Yakama (36.9%, a difference of 0.42%). Similarly, the demographic groups most similar to Immigrants from Morocco are Immigrants from Southern Europe (36.4%, a difference of 0.12%), Black/African American (36.5%, a difference of 0.21%), Immigrants from Northern Europe (36.5%, a difference of 0.28%), Albanian (36.5%, a difference of 0.40%), and Native/Alaskan (36.6%, a difference of 0.41%).
| Demographics | Rating | Rank | In Labor Force | Age 16-19 |
| Immigrants | Saudi Arabia | 73.9 /100 | #160 | Good 37.0% |
| Cambodians | 71.5 /100 | #161 | Good 37.0% |
| Immigrants | Jordan | 69.5 /100 | #162 | Good 36.9% |
| Bermudans | 69.3 /100 | #163 | Good 36.9% |
| Immigrants | Kuwait | 68.9 /100 | #164 | Good 36.9% |
| Yakama | 66.9 /100 | #165 | Good 36.9% |
| Immigrants | Western Africa | 66.7 /100 | #166 | Good 36.9% |
| Arabs | 63.6 /100 | #167 | Good 36.8% |
| Palestinians | 63.1 /100 | #168 | Good 36.8% |
| Immigrants | Latvia | 61.6 /100 | #169 | Good 36.8% |
| Immigrants | South Africa | 60.5 /100 | #170 | Good 36.8% |
| Immigrants | Cambodia | 58.4 /100 | #171 | Average 36.7% |
| South Africans | 58.3 /100 | #172 | Average 36.7% |
| Russians | 57.5 /100 | #173 | Average 36.7% |
| Immigrants | Czechoslovakia | 50.0 /100 | #174 | Average 36.6% |
| Natives/Alaskans | 49.0 /100 | #175 | Average 36.6% |
| Albanians | 48.8 /100 | #176 | Average 36.5% |
| Immigrants | Northern Europe | 46.6 /100 | #177 | Average 36.5% |
| Blacks/African Americans | 45.1 /100 | #178 | Average 36.5% |
| Immigrants | Southern Europe | 43.3 /100 | #179 | Average 36.4% |
| Immigrants | Morocco | 41.1 /100 | #180 | Average 36.4% |