Immigrants from Romania vs Immigrants from Oceania Seniors Poverty Over the Age of 65
COMPARE
Immigrants from Romania
Immigrants from Oceania
Seniors Poverty Over the Age of 65
Seniors Poverty Over the Age of 65 Comparison
Immigrants from Romania
Immigrants from Oceania
10.3%
SENIORS POVERTY OVER THE AGE OF 65
93.3/ 100
METRIC RATING
113th/ 347
METRIC RANK
10.4%
SENIORS POVERTY OVER THE AGE OF 65
88.4/ 100
METRIC RATING
130th/ 347
METRIC RANK
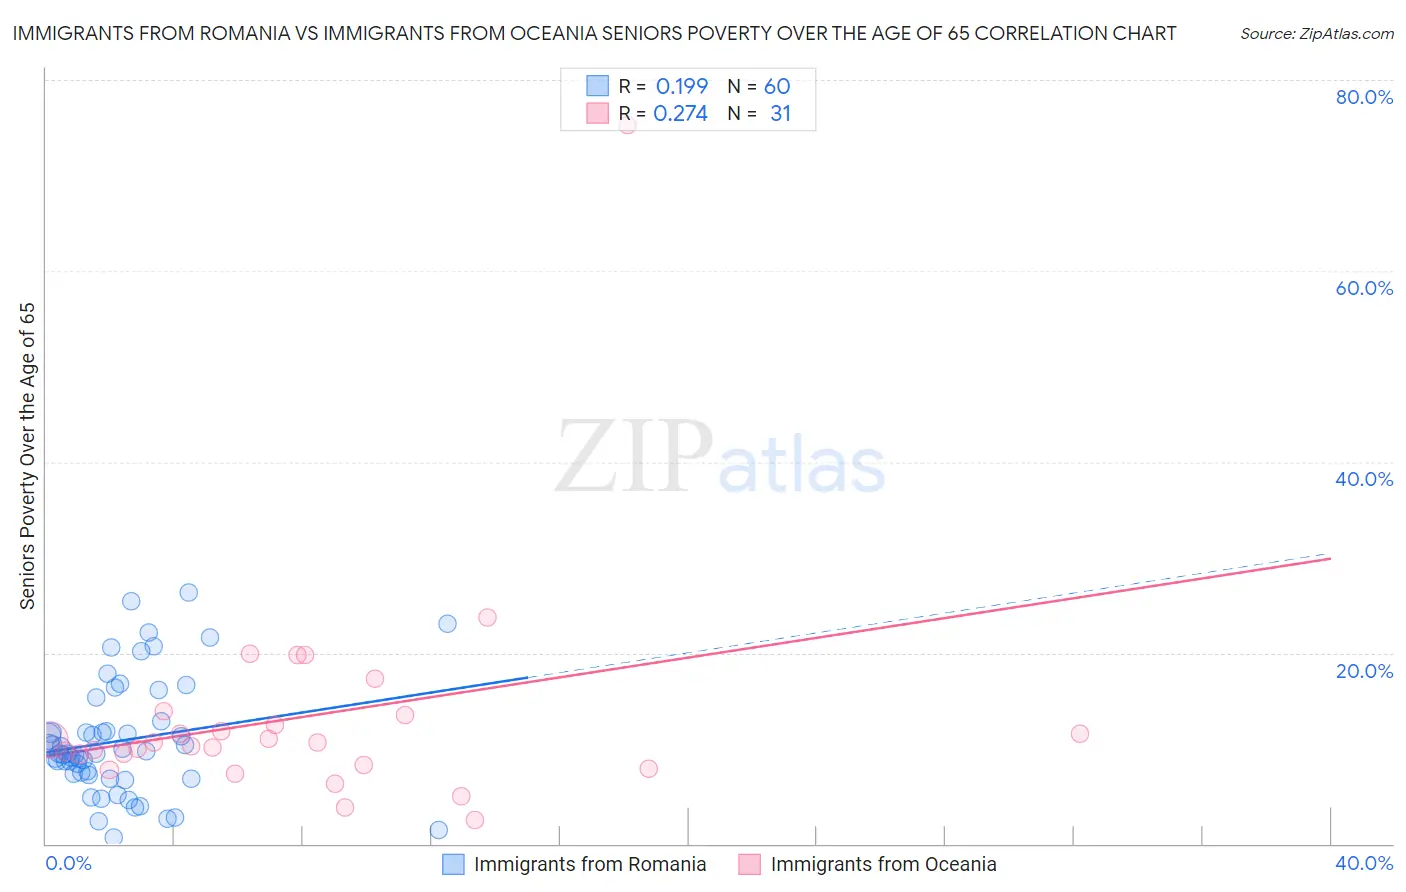
Immigrants from Romania vs Immigrants from Oceania Seniors Poverty Over the Age of 65 Correlation Chart
The statistical analysis conducted on geographies consisting of 256,618,313 people shows a poor positive correlation between the proportion of Immigrants from Romania and poverty level among seniors over the age of 65 in the United States with a correlation coefficient (R) of 0.199 and weighted average of 10.3%. Similarly, the statistical analysis conducted on geographies consisting of 304,434,853 people shows a weak positive correlation between the proportion of Immigrants from Oceania and poverty level among seniors over the age of 65 in the United States with a correlation coefficient (R) of 0.274 and weighted average of 10.4%, a difference of 1.4%.
Seniors Poverty Over the Age of 65 Correlation Summary
| Measurement | Immigrants from Romania | Immigrants from Oceania |
| Minimum | 0.70% | 2.5% |
| Maximum | 26.4% | 75.3% |
| Range | 25.7% | 72.8% |
| Mean | 10.8% | 13.3% |
| Median | 9.4% | 10.6% |
| Interquartile 25% (IQ1) | 7.3% | 8.3% |
| Interquartile 75% (IQ3) | 12.3% | 13.5% |
| Interquartile Range (IQR) | 5.0% | 5.2% |
| Standard Deviation (Sample) | 6.0% | 12.5% |
| Standard Deviation (Population) | 5.9% | 12.3% |
Demographics Similar to Immigrants from Romania and Immigrants from Oceania by Seniors Poverty Over the Age of 65
In terms of seniors poverty over the age of 65, the demographic groups most similar to Immigrants from Romania are Immigrants from Korea (10.3%, a difference of 0.040%), Immigrants from Belgium (10.3%, a difference of 0.060%), Immigrants from Denmark (10.3%, a difference of 0.19%), Immigrants from Italy (10.3%, a difference of 0.23%), and Pakistani (10.3%, a difference of 0.38%). Similarly, the demographic groups most similar to Immigrants from Oceania are Immigrants from Iran (10.4%, a difference of 0.0%), Ottawa (10.4%, a difference of 0.020%), Cambodian (10.4%, a difference of 0.15%), Egyptian (10.5%, a difference of 0.15%), and Immigrants from Hungary (10.4%, a difference of 0.16%).
| Demographics | Rating | Rank | Seniors Poverty Over the Age of 65 |
| Immigrants | Belgium | 93.4 /100 | #111 | Exceptional 10.3% |
| Immigrants | Korea | 93.3 /100 | #112 | Exceptional 10.3% |
| Immigrants | Romania | 93.3 /100 | #113 | Exceptional 10.3% |
| Immigrants | Denmark | 92.7 /100 | #114 | Exceptional 10.3% |
| Immigrants | Italy | 92.6 /100 | #115 | Exceptional 10.3% |
| Pakistanis | 92.2 /100 | #116 | Exceptional 10.3% |
| Lebanese | 92.0 /100 | #117 | Exceptional 10.3% |
| Okinawans | 91.7 /100 | #118 | Exceptional 10.4% |
| Immigrants | Western Europe | 91.1 /100 | #119 | Exceptional 10.4% |
| Immigrants | Bosnia and Herzegovina | 90.8 /100 | #120 | Exceptional 10.4% |
| Immigrants | Iraq | 90.7 /100 | #121 | Exceptional 10.4% |
| Immigrants | Moldova | 90.7 /100 | #122 | Exceptional 10.4% |
| Hmong | 90.0 /100 | #123 | Exceptional 10.4% |
| Asians | 89.9 /100 | #124 | Excellent 10.4% |
| Immigrants | Philippines | 89.4 /100 | #125 | Excellent 10.4% |
| Immigrants | Hungary | 89.1 /100 | #126 | Excellent 10.4% |
| Cambodians | 89.1 /100 | #127 | Excellent 10.4% |
| Ottawa | 88.5 /100 | #128 | Excellent 10.4% |
| Immigrants | Iran | 88.4 /100 | #129 | Excellent 10.4% |
| Immigrants | Oceania | 88.4 /100 | #130 | Excellent 10.4% |
| Egyptians | 87.8 /100 | #131 | Excellent 10.5% |