Immigrants from Romania vs Yugoslavian In Labor Force | Age 35-44
COMPARE
Immigrants from Romania
Yugoslavian
In Labor Force | Age 35-44
In Labor Force | Age 35-44 Comparison
Immigrants from Romania
Yugoslavians
84.8%
IN LABOR FORCE | AGE 35-44
94.7/ 100
METRIC RATING
107th/ 347
METRIC RANK
84.9%
IN LABOR FORCE | AGE 35-44
97.7/ 100
METRIC RATING
88th/ 347
METRIC RANK
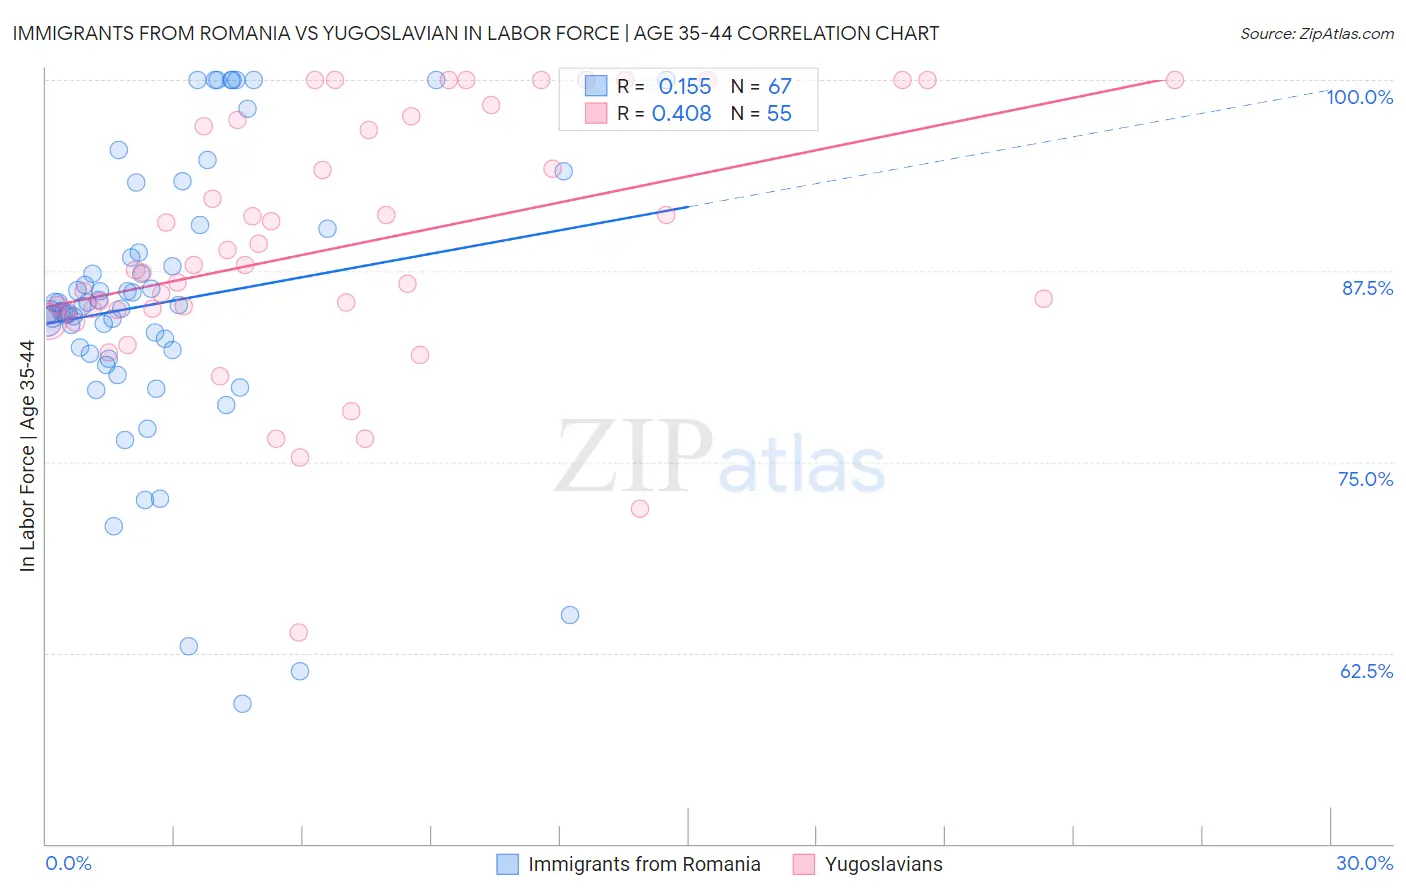
Immigrants from Romania vs Yugoslavian In Labor Force | Age 35-44 Correlation Chart
The statistical analysis conducted on geographies consisting of 256,974,600 people shows a poor positive correlation between the proportion of Immigrants from Romania and labor force participation rate among population between the ages 35 and 44 in the United States with a correlation coefficient (R) of 0.155 and weighted average of 84.8%. Similarly, the statistical analysis conducted on geographies consisting of 285,656,710 people shows a moderate positive correlation between the proportion of Yugoslavians and labor force participation rate among population between the ages 35 and 44 in the United States with a correlation coefficient (R) of 0.408 and weighted average of 84.9%, a difference of 0.14%.
In Labor Force | Age 35-44 Correlation Summary
| Measurement | Immigrants from Romania | Yugoslavian |
| Minimum | 59.2% | 63.8% |
| Maximum | 100.0% | 100.0% |
| Range | 40.8% | 36.2% |
| Mean | 85.5% | 89.1% |
| Median | 85.2% | 87.9% |
| Interquartile 25% (IQ1) | 82.1% | 85.0% |
| Interquartile 75% (IQ3) | 90.3% | 97.4% |
| Interquartile Range (IQR) | 8.2% | 12.4% |
| Standard Deviation (Sample) | 9.3% | 8.3% |
| Standard Deviation (Population) | 9.2% | 8.2% |
Demographics Similar to Immigrants from Romania and Yugoslavians by In Labor Force | Age 35-44
In terms of in labor force | age 35-44, the demographic groups most similar to Immigrants from Romania are Immigrants from Bahamas (84.8%, a difference of 0.0%), South American (84.8%, a difference of 0.010%), Immigrants from Southern Europe (84.8%, a difference of 0.020%), Immigrants from Belarus (84.8%, a difference of 0.020%), and Immigrants from Sweden (84.8%, a difference of 0.020%). Similarly, the demographic groups most similar to Yugoslavians are Belgian (84.9%, a difference of 0.0%), Immigrants from Pakistan (84.9%, a difference of 0.020%), Immigrants from France (84.9%, a difference of 0.020%), Immigrants from Europe (84.9%, a difference of 0.030%), and Ghanaian (84.8%, a difference of 0.040%).
| Demographics | Rating | Rank | In Labor Force | Age 35-44 |
| Belgians | 97.7 /100 | #87 | Exceptional 84.9% |
| Yugoslavians | 97.7 /100 | #88 | Exceptional 84.9% |
| Immigrants | Pakistan | 97.5 /100 | #89 | Exceptional 84.9% |
| Immigrants | France | 97.4 /100 | #90 | Exceptional 84.9% |
| Immigrants | Europe | 97.2 /100 | #91 | Exceptional 84.9% |
| Ghanaians | 97.2 /100 | #92 | Exceptional 84.8% |
| Immigrants | Northern Africa | 97.1 /100 | #93 | Exceptional 84.8% |
| Mongolians | 96.8 /100 | #94 | Exceptional 84.8% |
| Immigrants | Kuwait | 96.7 /100 | #95 | Exceptional 84.8% |
| Cubans | 96.6 /100 | #96 | Exceptional 84.8% |
| Egyptians | 96.6 /100 | #97 | Exceptional 84.8% |
| Indians (Asian) | 96.1 /100 | #98 | Exceptional 84.8% |
| Haitians | 96.0 /100 | #99 | Exceptional 84.8% |
| Immigrants | Czechoslovakia | 95.9 /100 | #100 | Exceptional 84.8% |
| Immigrants | Australia | 95.5 /100 | #101 | Exceptional 84.8% |
| Immigrants | Southern Europe | 95.3 /100 | #102 | Exceptional 84.8% |
| Immigrants | Belarus | 95.3 /100 | #103 | Exceptional 84.8% |
| Immigrants | Sweden | 95.2 /100 | #104 | Exceptional 84.8% |
| South Americans | 95.0 /100 | #105 | Exceptional 84.8% |
| Immigrants | Bahamas | 94.8 /100 | #106 | Exceptional 84.8% |
| Immigrants | Romania | 94.7 /100 | #107 | Exceptional 84.8% |