Immigrants from Romania vs French In Labor Force | Age 35-44
COMPARE
Immigrants from Romania
French
In Labor Force | Age 35-44
In Labor Force | Age 35-44 Comparison
Immigrants from Romania
French
84.8%
IN LABOR FORCE | AGE 35-44
94.7/ 100
METRIC RATING
107th/ 347
METRIC RANK
84.0%
IN LABOR FORCE | AGE 35-44
7.5/ 100
METRIC RATING
220th/ 347
METRIC RANK
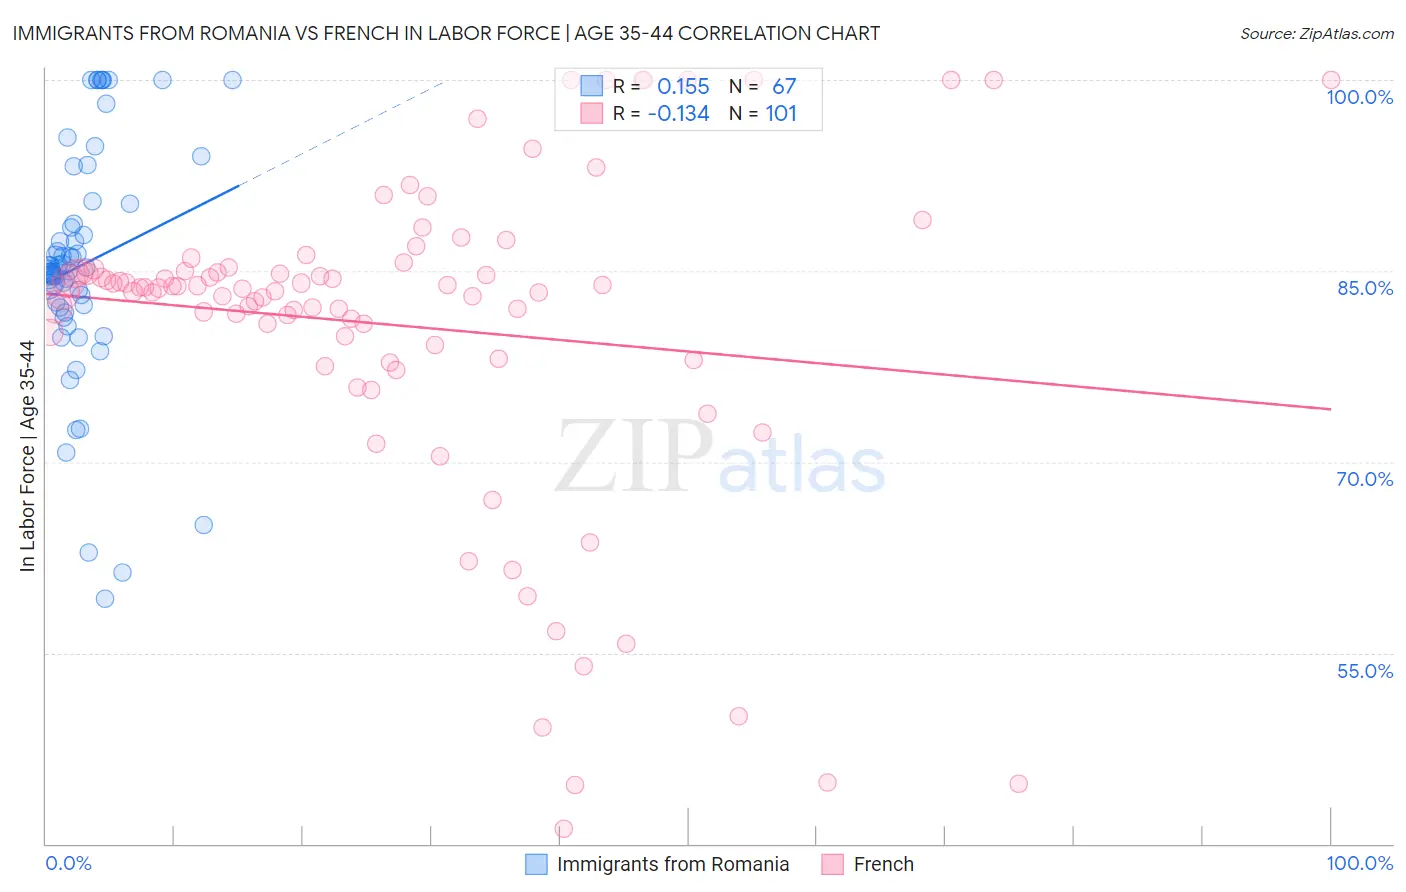
Immigrants from Romania vs French In Labor Force | Age 35-44 Correlation Chart
The statistical analysis conducted on geographies consisting of 256,974,600 people shows a poor positive correlation between the proportion of Immigrants from Romania and labor force participation rate among population between the ages 35 and 44 in the United States with a correlation coefficient (R) of 0.155 and weighted average of 84.8%. Similarly, the statistical analysis conducted on geographies consisting of 571,709,167 people shows a poor negative correlation between the proportion of French and labor force participation rate among population between the ages 35 and 44 in the United States with a correlation coefficient (R) of -0.134 and weighted average of 84.0%, a difference of 0.88%.
In Labor Force | Age 35-44 Correlation Summary
| Measurement | Immigrants from Romania | French |
| Minimum | 59.2% | 41.2% |
| Maximum | 100.0% | 100.0% |
| Range | 40.8% | 58.8% |
| Mean | 85.5% | 80.7% |
| Median | 85.2% | 83.7% |
| Interquartile 25% (IQ1) | 82.1% | 78.6% |
| Interquartile 75% (IQ3) | 90.3% | 85.1% |
| Interquartile Range (IQR) | 8.2% | 6.4% |
| Standard Deviation (Sample) | 9.3% | 12.8% |
| Standard Deviation (Population) | 9.2% | 12.8% |
Similar Demographics by In Labor Force | Age 35-44
Demographics Similar to Immigrants from Romania by In Labor Force | Age 35-44
In terms of in labor force | age 35-44, the demographic groups most similar to Immigrants from Romania are Immigrants from Bahamas (84.8%, a difference of 0.0%), South American (84.8%, a difference of 0.010%), Immigrants from Argentina (84.8%, a difference of 0.010%), Immigrants from Russia (84.8%, a difference of 0.010%), and Immigrants from Southern Europe (84.8%, a difference of 0.020%).
| Demographics | Rating | Rank | In Labor Force | Age 35-44 |
| Immigrants | Czechoslovakia | 95.9 /100 | #100 | Exceptional 84.8% |
| Immigrants | Australia | 95.5 /100 | #101 | Exceptional 84.8% |
| Immigrants | Southern Europe | 95.3 /100 | #102 | Exceptional 84.8% |
| Immigrants | Belarus | 95.3 /100 | #103 | Exceptional 84.8% |
| Immigrants | Sweden | 95.2 /100 | #104 | Exceptional 84.8% |
| South Americans | 95.0 /100 | #105 | Exceptional 84.8% |
| Immigrants | Bahamas | 94.8 /100 | #106 | Exceptional 84.8% |
| Immigrants | Romania | 94.7 /100 | #107 | Exceptional 84.8% |
| Immigrants | Argentina | 94.5 /100 | #108 | Exceptional 84.8% |
| Immigrants | Russia | 94.5 /100 | #109 | Exceptional 84.8% |
| Filipinos | 93.8 /100 | #110 | Exceptional 84.7% |
| Ukrainians | 93.5 /100 | #111 | Exceptional 84.7% |
| Immigrants | Western Africa | 93.4 /100 | #112 | Exceptional 84.7% |
| Uruguayans | 93.3 /100 | #113 | Exceptional 84.7% |
| Chileans | 93.2 /100 | #114 | Exceptional 84.7% |
Demographics Similar to French by In Labor Force | Age 35-44
In terms of in labor force | age 35-44, the demographic groups most similar to French are Icelander (84.0%, a difference of 0.020%), Assyrian/Chaldean/Syriac (84.0%, a difference of 0.020%), Immigrants from Panama (84.0%, a difference of 0.030%), Immigrants from Nicaragua (84.1%, a difference of 0.040%), and Subsaharan African (84.1%, a difference of 0.040%).
| Demographics | Rating | Rank | In Labor Force | Age 35-44 |
| Bangladeshis | 13.7 /100 | #213 | Poor 84.1% |
| Immigrants | Barbados | 13.2 /100 | #214 | Poor 84.1% |
| Europeans | 12.2 /100 | #215 | Poor 84.1% |
| Nicaraguans | 12.1 /100 | #216 | Poor 84.1% |
| Immigrants | Norway | 11.7 /100 | #217 | Poor 84.1% |
| Immigrants | Nicaragua | 9.4 /100 | #218 | Tragic 84.1% |
| Sub-Saharan Africans | 9.3 /100 | #219 | Tragic 84.1% |
| French | 7.5 /100 | #220 | Tragic 84.0% |
| Icelanders | 6.7 /100 | #221 | Tragic 84.0% |
| Assyrians/Chaldeans/Syriacs | 6.6 /100 | #222 | Tragic 84.0% |
| Immigrants | Panama | 6.4 /100 | #223 | Tragic 84.0% |
| U.S. Virgin Islanders | 6.1 /100 | #224 | Tragic 84.0% |
| Immigrants | Burma/Myanmar | 6.1 /100 | #225 | Tragic 84.0% |
| Panamanians | 5.4 /100 | #226 | Tragic 84.0% |
| British West Indians | 5.3 /100 | #227 | Tragic 84.0% |