Immigrants from Romania vs Immigrants from Oceania Unemployment Among Youth under 25 years
COMPARE
Immigrants from Romania
Immigrants from Oceania
Unemployment Among Youth under 25 years
Unemployment Among Youth under 25 years Comparison
Immigrants from Romania
Immigrants from Oceania
11.5%
UNEMPLOYMENT AMONG YOUTH UNDER 25 YEARS
66.3/ 100
METRIC RATING
155th/ 347
METRIC RANK
11.4%
UNEMPLOYMENT AMONG YOUTH UNDER 25 YEARS
80.2/ 100
METRIC RATING
135th/ 347
METRIC RANK
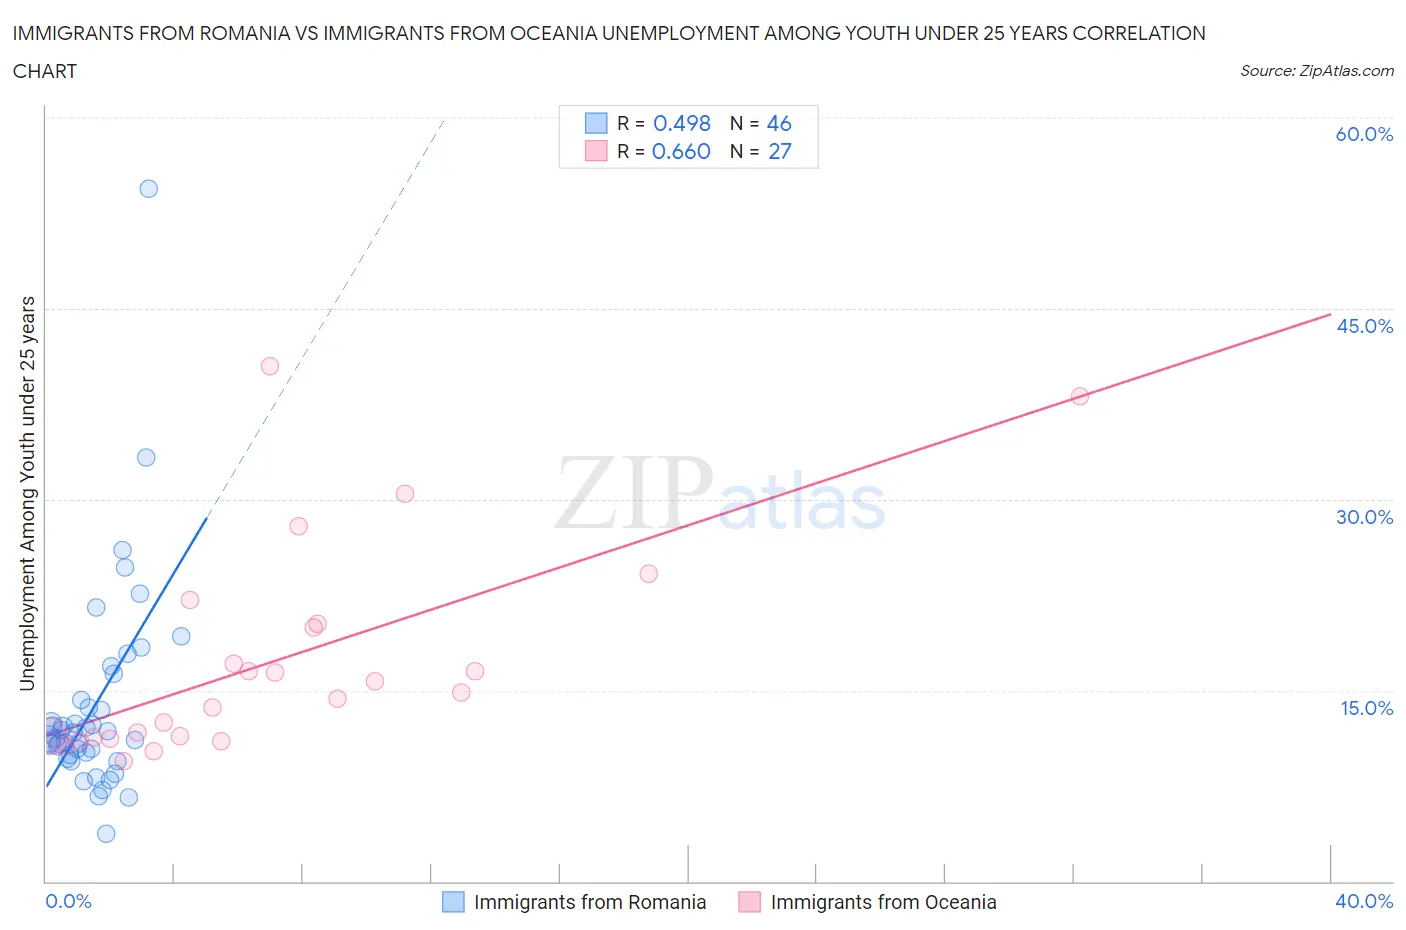
Immigrants from Romania vs Immigrants from Oceania Unemployment Among Youth under 25 years Correlation Chart
The statistical analysis conducted on geographies consisting of 255,276,474 people shows a moderate positive correlation between the proportion of Immigrants from Romania and unemployment rate among youth under the age of 25 in the United States with a correlation coefficient (R) of 0.498 and weighted average of 11.5%. Similarly, the statistical analysis conducted on geographies consisting of 302,499,888 people shows a significant positive correlation between the proportion of Immigrants from Oceania and unemployment rate among youth under the age of 25 in the United States with a correlation coefficient (R) of 0.660 and weighted average of 11.4%, a difference of 0.76%.
Unemployment Among Youth under 25 years Correlation Summary
| Measurement | Immigrants from Romania | Immigrants from Oceania |
| Minimum | 3.7% | 9.4% |
| Maximum | 54.4% | 40.5% |
| Range | 50.7% | 31.1% |
| Mean | 13.8% | 17.4% |
| Median | 11.5% | 14.8% |
| Interquartile 25% (IQ1) | 9.9% | 11.3% |
| Interquartile 75% (IQ3) | 14.3% | 20.2% |
| Interquartile Range (IQR) | 4.3% | 8.9% |
| Standard Deviation (Sample) | 8.3% | 8.3% |
| Standard Deviation (Population) | 8.2% | 8.2% |
Demographics Similar to Immigrants from Romania and Immigrants from Oceania by Unemployment Among Youth under 25 years
In terms of unemployment among youth under 25 years, the demographic groups most similar to Immigrants from Romania are Immigrants from Asia (11.5%, a difference of 0.020%), Immigrants from Czechoslovakia (11.5%, a difference of 0.040%), Iraqi (11.5%, a difference of 0.090%), Uruguayan (11.5%, a difference of 0.20%), and Immigrants from Switzerland (11.5%, a difference of 0.26%). Similarly, the demographic groups most similar to Immigrants from Oceania are Romanian (11.4%, a difference of 0.010%), Asian (11.4%, a difference of 0.040%), Immigrants from England (11.5%, a difference of 0.14%), Immigrants from Indonesia (11.5%, a difference of 0.16%), and Immigrants from Belgium (11.5%, a difference of 0.17%).
| Demographics | Rating | Rank | Unemployment Among Youth under 25 years |
| Immigrants | Oceania | 80.2 /100 | #135 | Excellent 11.4% |
| Romanians | 80.1 /100 | #136 | Excellent 11.4% |
| Asians | 79.7 /100 | #137 | Good 11.4% |
| Immigrants | England | 78.1 /100 | #138 | Good 11.5% |
| Immigrants | Indonesia | 77.6 /100 | #139 | Good 11.5% |
| Immigrants | Belgium | 77.5 /100 | #140 | Good 11.5% |
| Immigrants | Uruguay | 76.1 /100 | #141 | Good 11.5% |
| Immigrants | Korea | 75.1 /100 | #142 | Good 11.5% |
| Immigrants | Uganda | 74.5 /100 | #143 | Good 11.5% |
| Immigrants | Brazil | 74.3 /100 | #144 | Good 11.5% |
| Argentineans | 73.0 /100 | #145 | Good 11.5% |
| Brazilians | 72.5 /100 | #146 | Good 11.5% |
| Laotians | 72.4 /100 | #147 | Good 11.5% |
| Immigrants | Northern Europe | 72.1 /100 | #148 | Good 11.5% |
| Immigrants | Cambodia | 71.8 /100 | #149 | Good 11.5% |
| Immigrants | Switzerland | 71.6 /100 | #150 | Good 11.5% |
| Uruguayans | 70.4 /100 | #151 | Good 11.5% |
| Iraqis | 68.3 /100 | #152 | Good 11.5% |
| Immigrants | Czechoslovakia | 67.1 /100 | #153 | Good 11.5% |
| Immigrants | Asia | 66.7 /100 | #154 | Good 11.5% |
| Immigrants | Romania | 66.3 /100 | #155 | Good 11.5% |