Immigrants from Philippines vs Immigrants from South America In Labor Force | Age > 16

COMPARE

Immigrants from Philippines
Race
Ancestry
AfghanAfricanAlaska NativeAlaskan AthabascanAlbanianAleutAlsatianAmericanApacheArabArapahoArgentineanArmenianAssyrian/Chaldean/SyriacAustralianAustrianBahamianBangladeshiBarbadianBasqueBelgianBelizeanBermudanBhutaneseBlackfeetBolivianBrazilianBritishBritish West IndianBulgarianBurmeseCajunCambodianCanadianCape VerdeanCarpatho RusynCelticCentral AmericanCentral American IndianCherokeeCheyenneChickasawChileanChineseChippewaChoctawColombianColvilleComancheCosta RicanCreeCreekCroatianCrowCubanCypriotCzechCzechoslovakianDanishDelawareDominicanDutchDutch West IndianEastern EuropeanEcuadorianEgyptianEnglishEstonianEthiopianEuropeanFijianFilipinoFinnishFrenchFrench American IndianFrench CanadianGermanGerman RussianGhanaianGreekGuamanian/ChamorroGuatemalanGuyaneseHaitianHmongHonduranHopiHoumaHungarianIcelanderIndian (Asian)IndonesianInupiatIranianIraqiIrishIroquoisIsraeliItalianJamaicanJapaneseJordanianKenyanKiowaKoreanLaotianLatvianLebaneseLiberianLithuanianLumbeeLuxembourgerMacedonianMalaysianMalteseMarshalleseMenomineeMexicanMexican American IndianMongolianMoroccanNative HawaiianNavajoNepaleseNew ZealanderNicaraguanNigerianNorthern EuropeanNorwegianOkinawanOsageOttawaPaiutePakistaniPalestinianPanamanianParaguayanPennsylvania GermanPeruvianPimaPolishPortuguesePotawatomiPuebloPuerto RicanPuget Sound SalishRomanianRussianSalvadoranSamoanScandinavianScotch-IrishScottishSeminoleSenegaleseSerbianShoshoneSierra LeoneanSiouxSlavicSlovakSloveneSomaliSouth AfricanSouth AmericanSouth American IndianSoviet UnionSpaniardSpanishSpanish AmericanSpanish American IndianSri LankanSubsaharan AfricanSudaneseSwedishSwissSyrianTaiwaneseThaiTlingit-HaidaTohono O'OdhamTonganTrinidadian and TobagonianTsimshianTurkishU.S. Virgin IslanderUgandanUkrainianUruguayanUteVenezuelanVietnameseWelshWest IndianYakamaYaquiYugoslavianYumanYup'ikZimbabwean
Immigration
NonimmigrantsImmigrantsAfghanistanAfricaAlbaniaArgentinaArmeniaAsiaAustraliaAustriaBahamasBangladeshBarbadosBelarusBelgiumBelizeBoliviaBosnia and HerzegovinaBrazilBulgariaBurma/MyanmarCabo VerdeCambodiaCameroonCanadaCaribbeanCentral AmericaChileChinaColombiaCongoCosta RicaCroatiaCubaCzechoslovakiaDenmarkDominicaDominican RepublicEastern AfricaEastern AsiaEastern EuropeEcuadorEgyptEl SalvadorEnglandEritreaEthiopiaEuropeFijiFranceGermanyGhanaGreeceGrenadaGuatemalaGuyanaHaitiHondurasHong KongHungaryIndiaIndonesiaIranIraqIrelandIsraelItalyJamaicaJapanJordanKazakhstanKenyaKoreaKuwaitLaosLatin AmericaLatviaLebanonLiberiaLithuaniaMalaysiaMexicoMicronesiaMiddle AfricaMoldovaMoroccoNepalNetherlandsNicaraguaNigeriaNorth AmericaNorth MacedoniaNorthern AfricaNorthern EuropeNorwayOceaniaPakistanPanamaPeruPhilippinesPolandPortugalRomaniaRussiaSaudi ArabiaScotlandSenegalSerbiaSierra LeoneSingaporeSomaliaSouth AfricaSouth Central AsiaSouth Eastern AsiaSouthern EuropeSpainSri LankaSt. Vincent and the GrenadinesSudanSwedenSwitzerlandSyriaTaiwanThailandTrinidad and TobagoTurkeyUgandaUkraineUruguayUzbekistanVenezuelaVietnamWest IndiesWestern AfricaWestern AsiaWestern EuropeYemenZaireZimbabweAzores
Immigrants from South America
Race
Ancestry
AfghanAfricanAlaska NativeAlaskan AthabascanAlbanianAleutAlsatianAmericanApacheArabArapahoArgentineanArmenianAssyrian/Chaldean/SyriacAustralianAustrianBahamianBangladeshiBarbadianBasqueBelgianBelizeanBermudanBhutaneseBlackfeetBolivianBrazilianBritishBritish West IndianBulgarianBurmeseCajunCambodianCanadianCape VerdeanCarpatho RusynCelticCentral AmericanCentral American IndianCherokeeCheyenneChickasawChileanChineseChippewaChoctawColombianColvilleComancheCosta RicanCreeCreekCroatianCrowCubanCypriotCzechCzechoslovakianDanishDelawareDominicanDutchDutch West IndianEastern EuropeanEcuadorianEgyptianEnglishEstonianEthiopianEuropeanFijianFilipinoFinnishFrenchFrench American IndianFrench CanadianGermanGerman RussianGhanaianGreekGuamanian/ChamorroGuatemalanGuyaneseHaitianHmongHonduranHopiHoumaHungarianIcelanderIndian (Asian)IndonesianInupiatIranianIraqiIrishIroquoisIsraeliItalianJamaicanJapaneseJordanianKenyanKiowaKoreanLaotianLatvianLebaneseLiberianLithuanianLumbeeLuxembourgerMacedonianMalaysianMalteseMarshalleseMenomineeMexicanMexican American IndianMongolianMoroccanNative HawaiianNavajoNepaleseNew ZealanderNicaraguanNigerianNorthern EuropeanNorwegianOkinawanOsageOttawaPaiutePakistaniPalestinianPanamanianParaguayanPennsylvania GermanPeruvianPimaPolishPortuguesePotawatomiPuebloPuerto RicanPuget Sound SalishRomanianRussianSalvadoranSamoanScandinavianScotch-IrishScottishSeminoleSenegaleseSerbianShoshoneSierra LeoneanSiouxSlavicSlovakSloveneSomaliSouth AfricanSouth AmericanSouth American IndianSoviet UnionSpaniardSpanishSpanish AmericanSpanish American IndianSri LankanSubsaharan AfricanSudaneseSwedishSwissSyrianTaiwaneseThaiTlingit-HaidaTohono O'OdhamTonganTrinidadian and TobagonianTsimshianTurkishU.S. Virgin IslanderUgandanUkrainianUruguayanUteVenezuelanVietnameseWelshWest IndianYakamaYaquiYugoslavianYumanYup'ikZimbabwean
Immigration
NonimmigrantsImmigrantsAfghanistanAfricaAlbaniaArgentinaArmeniaAsiaAustraliaAustriaBahamasBangladeshBarbadosBelarusBelgiumBelizeBoliviaBosnia and HerzegovinaBrazilBulgariaBurma/MyanmarCabo VerdeCambodiaCameroonCanadaCaribbeanCentral AmericaChileChinaColombiaCongoCosta RicaCroatiaCubaCzechoslovakiaDenmarkDominicaDominican RepublicEastern AfricaEastern AsiaEastern EuropeEcuadorEgyptEl SalvadorEnglandEritreaEthiopiaEuropeFijiFranceGermanyGhanaGreeceGrenadaGuatemalaGuyanaHaitiHondurasHong KongHungaryIndiaIndonesiaIranIraqIrelandIsraelItalyJamaicaJapanJordanKazakhstanKenyaKoreaKuwaitLaosLatin AmericaLatviaLebanonLiberiaLithuaniaMalaysiaMexicoMicronesiaMiddle AfricaMoldovaMoroccoNepalNetherlandsNicaraguaNigeriaNorth AmericaNorth MacedoniaNorthern AfricaNorthern EuropeNorwayOceaniaPakistanPanamaPeruPolandPortugalRomaniaRussiaSaudi ArabiaScotlandSenegalSerbiaSierra LeoneSingaporeSomaliaSouth AfricaSouth AmericaSouth Central AsiaSouth Eastern AsiaSouthern EuropeSpainSri LankaSt. Vincent and the GrenadinesSudanSwedenSwitzerlandSyriaTaiwanThailandTrinidad and TobagoTurkeyUgandaUkraineUruguayUzbekistanVenezuelaVietnamWest IndiesWestern AfricaWestern AsiaWestern EuropeYemenZaireZimbabweAzores
In Labor Force | Age > 16
Income
Poverty
Unemployment
Labor Participation
Family Structure
Vehicle Availability
Education Level
Disability

In Labor Force | Age > 16 Comparison

Immigrants from Philippines

Immigrants from South America

Exceptional
Exceptional
65.6%
IN LABOR FORCE | AGE > 16
94.5/ 100
METRIC RATING
129th/ 347
METRIC RANK
66.0%
IN LABOR FORCE | AGE > 16
99.1/ 100
METRIC RATING
93rd/ 347
METRIC RANK

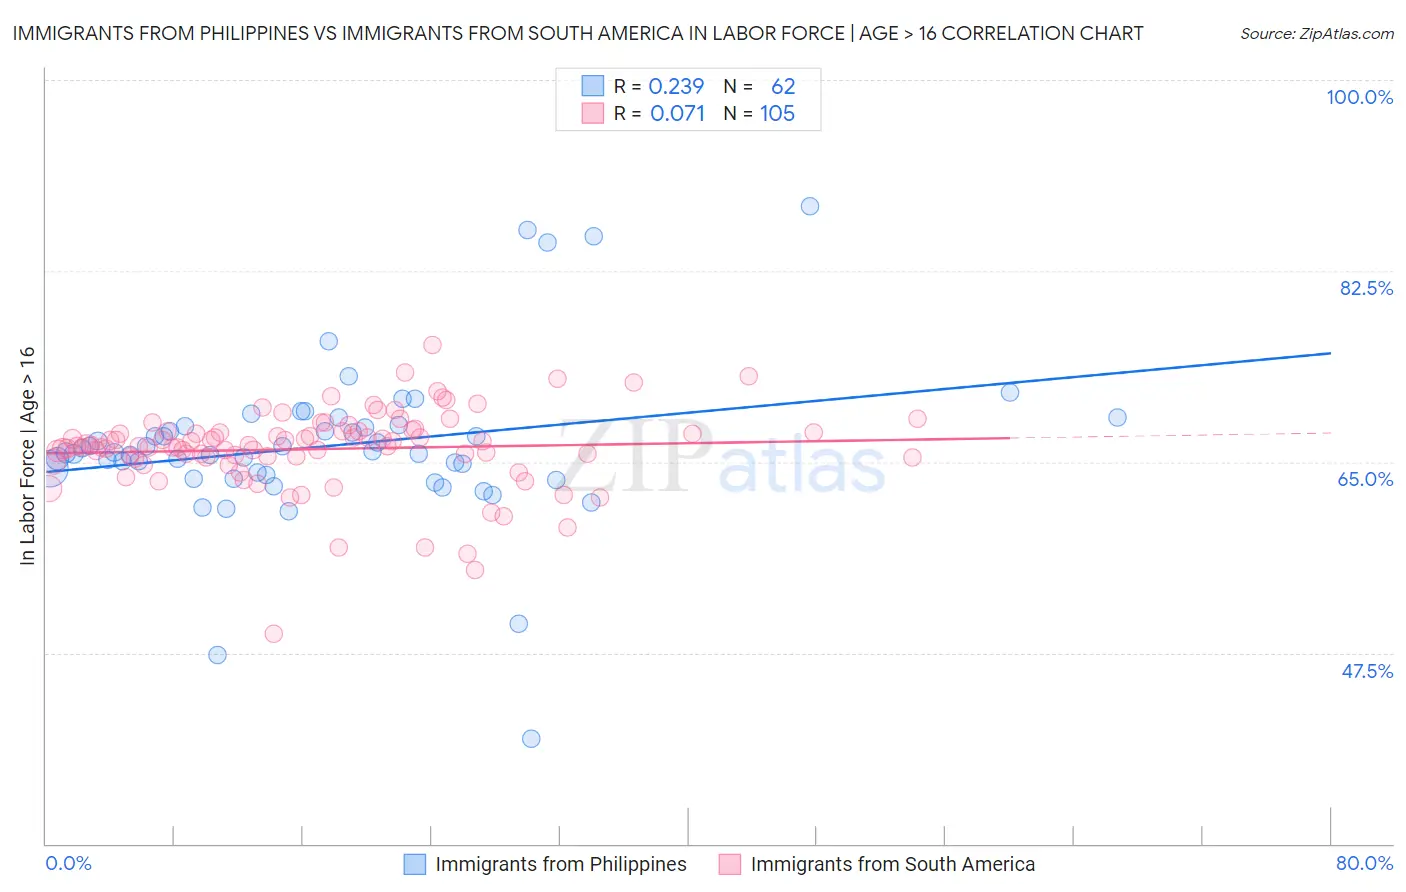
Immigrants from Philippines vs Immigrants from South America In Labor Force | Age > 16 Correlation Chart

The statistical analysis conducted on geographies consisting of 471,291,976 people shows a weak positive correlation between the proportion of Immigrants from Philippines and labor force participation rate among population ages 16 and over in the United States with a correlation coefficient (R) of 0.239 and weighted average of 65.6%. Similarly, the statistical analysis conducted on geographies consisting of 486,427,951 people shows a slight positive correlation between the proportion of Immigrants from South America and labor force participation rate among population ages 16 and over in the United States with a correlation coefficient (R) of 0.071 and weighted average of 66.0%, a difference of 0.53%.
Immigrants from Philippines vs Immigrants from South America In Labor Force | Age > 16

In Labor Force | Age > 16 Correlation Summary

MeasurementImmigrants from PhilippinesImmigrants from South America
Minimum39.6%49.2%
Maximum88.4%75.7%
Range48.8%26.5%
Mean66.5%66.2%
Median65.8%66.5%
Interquartile 25% (IQ1)63.8%65.4%
Interquartile 75% (IQ3)68.3%67.8%
Interquartile Range (IQR)4.5%2.4%
Standard Deviation (Sample)7.5%3.8%
Standard Deviation (Population)7.5%3.8%

Similar Demographics by In Labor Force | Age > 16

Demographics Similar to Immigrants from Philippines by In Labor Force | Age > 16

In terms of in labor force | age > 16, the demographic groups most similar to Immigrants from Philippines are Immigrants from Guatemala (65.6%, a difference of 0.0%), Ecuadorian (65.6%, a difference of 0.010%), Icelander (65.6%, a difference of 0.010%), Immigrants from Eastern Asia (65.7%, a difference of 0.020%), and Immigrants from North Macedonia (65.6%, a difference of 0.020%).
DemographicsRating | RankIn Labor Force | Age > 16
Immigrants | Ecuador
95.9
/100
|
#122
Exceptional
65.7%
Immigrants | Iraq
95.5
/100
|
#123
Exceptional
65.7%
Iraqis
95.4
/100
|
#124
Exceptional
65.7%
Norwegians
95.3
/100
|
#125
Exceptional
65.7%
Koreans
95.3
/100
|
#126
Exceptional
65.7%
Immigrants | Eastern Asia
94.9
/100
|
#127
Exceptional
65.7%
Ecuadorians
94.7
/100
|
#128
Exceptional
65.6%
Immigrants | Philippines
94.5
/100
|
#129
Exceptional
65.6%
Immigrants | Guatemala
94.4
/100
|
#130
Exceptional
65.6%
Icelanders
94.3
/100
|
#131
Exceptional
65.6%
Immigrants | North Macedonia
94.1
/100
|
#132
Exceptional
65.6%
Immigrants | Lithuania
93.5
/100
|
#133
Exceptional
65.6%
Costa Ricans
93.2
/100
|
#134
Exceptional
65.6%
Guatemalans
92.5
/100
|
#135
Exceptional
65.6%
Immigrants | Argentina
92.4
/100
|
#136
Exceptional
65.6%

Demographics Similar to Immigrants from South America by In Labor Force | Age > 16

In terms of in labor force | age > 16, the demographic groups most similar to Immigrants from South America are Aleut (66.0%, a difference of 0.010%), Immigrants from Cambodia (66.0%, a difference of 0.020%), Immigrants from Uruguay (66.0%, a difference of 0.020%), Immigrants from Laos (66.0%, a difference of 0.030%), and Chilean (66.0%, a difference of 0.030%).
DemographicsRating | RankIn Labor Force | Age > 16
South Americans
99.4
/100
|
#86
Exceptional
66.0%
South American Indians
99.4
/100
|
#87
Exceptional
66.0%
Bermudans
99.3
/100
|
#88
Exceptional
66.0%
Immigrants | Laos
99.2
/100
|
#89
Exceptional
66.0%
Chileans
99.2
/100
|
#90
Exceptional
66.0%
Iranians
99.2
/100
|
#91
Exceptional
66.0%
Aleuts
99.1
/100
|
#92
Exceptional
66.0%
Immigrants | South America
99.1
/100
|
#93
Exceptional
66.0%
Immigrants | Cambodia
99.1
/100
|
#94
Exceptional
66.0%
Immigrants | Uruguay
99.1
/100
|
#95
Exceptional
66.0%
Bangladeshis
98.9
/100
|
#96
Exceptional
65.9%
Filipinos
98.9
/100
|
#97
Exceptional
65.9%
Immigrants | Chile
98.7
/100
|
#98
Exceptional
65.9%
Immigrants | Australia
98.7
/100
|
#99
Exceptional
65.9%
Okinawans
98.7
/100
|
#100
Exceptional
65.9%