Canadian vs Immigrants from South America In Labor Force | Age > 16
COMPARE
Canadian
Immigrants from South America
In Labor Force | Age > 16
In Labor Force | Age > 16 Comparison
Canadians
Immigrants from South America
64.1%
IN LABOR FORCE | AGE > 16
0.5/ 100
METRIC RATING
267th/ 347
METRIC RANK
66.0%
IN LABOR FORCE | AGE > 16
99.1/ 100
METRIC RATING
93rd/ 347
METRIC RANK
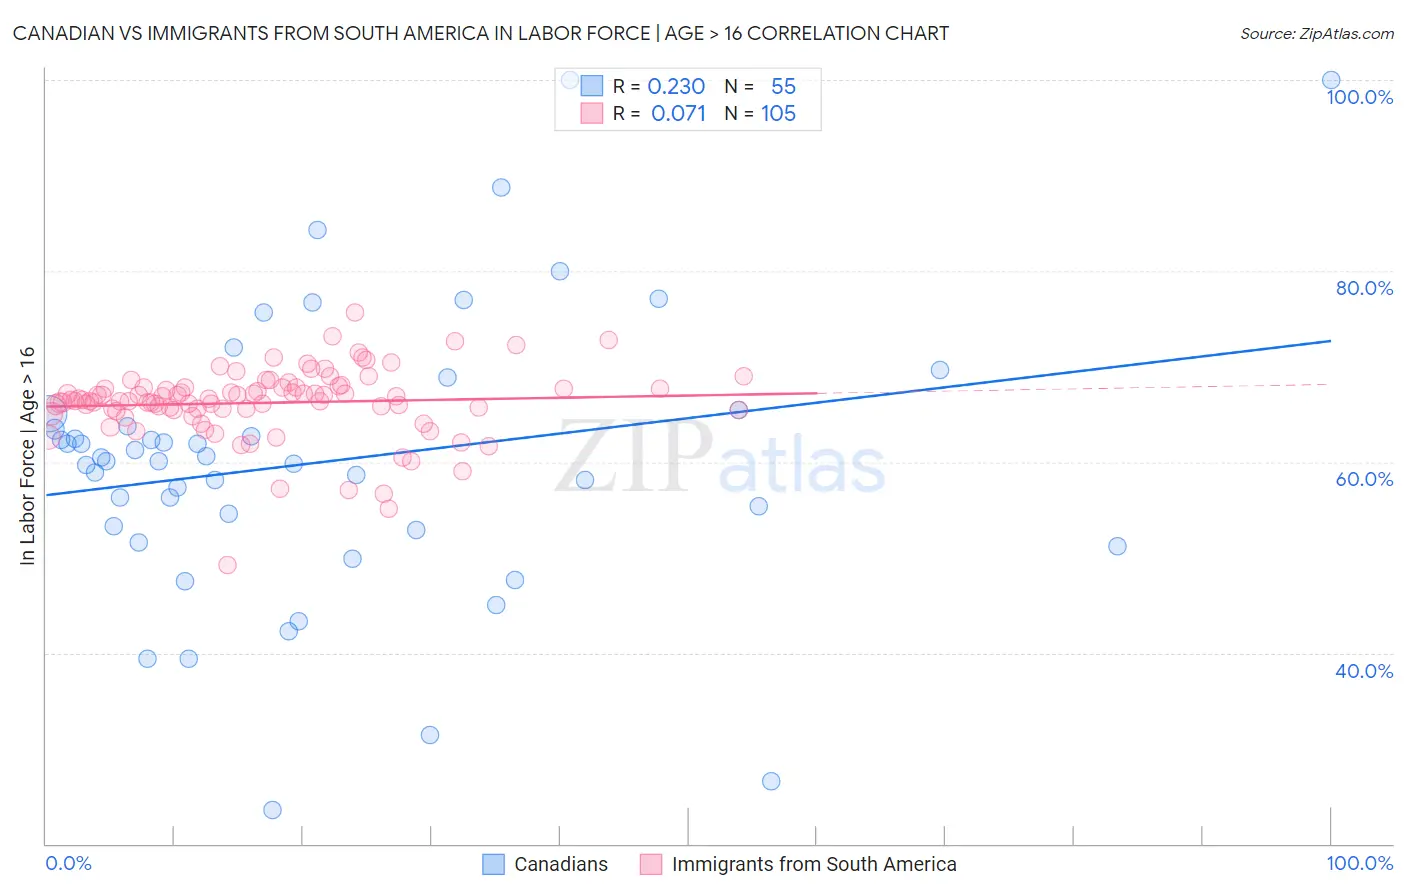
Canadian vs Immigrants from South America In Labor Force | Age > 16 Correlation Chart
The statistical analysis conducted on geographies consisting of 437,567,270 people shows a weak positive correlation between the proportion of Canadians and labor force participation rate among population ages 16 and over in the United States with a correlation coefficient (R) of 0.230 and weighted average of 64.1%. Similarly, the statistical analysis conducted on geographies consisting of 486,427,951 people shows a slight positive correlation between the proportion of Immigrants from South America and labor force participation rate among population ages 16 and over in the United States with a correlation coefficient (R) of 0.071 and weighted average of 66.0%, a difference of 2.9%.
In Labor Force | Age > 16 Correlation Summary
| Measurement | Canadian | Immigrants from South America |
| Minimum | 23.5% | 49.2% |
| Maximum | 100.0% | 75.7% |
| Range | 76.5% | 26.5% |
| Mean | 60.1% | 66.2% |
| Median | 60.1% | 66.5% |
| Interquartile 25% (IQ1) | 52.8% | 65.4% |
| Interquartile 75% (IQ3) | 65.0% | 67.8% |
| Interquartile Range (IQR) | 12.2% | 2.4% |
| Standard Deviation (Sample) | 15.1% | 3.8% |
| Standard Deviation (Population) | 14.9% | 3.8% |
Similar Demographics by In Labor Force | Age > 16
Demographics Similar to Canadians by In Labor Force | Age > 16
In terms of in labor force | age > 16, the demographic groups most similar to Canadians are Spaniard (64.1%, a difference of 0.0%), Immigrants from England (64.2%, a difference of 0.010%), Cuban (64.2%, a difference of 0.020%), Irish (64.1%, a difference of 0.040%), and Dutch (64.2%, a difference of 0.060%).
| Demographics | Rating | Rank | In Labor Force | Age > 16 |
| Marshallese | 0.7 /100 | #260 | Tragic 64.2% |
| Basques | 0.7 /100 | #261 | Tragic 64.2% |
| Finns | 0.7 /100 | #262 | Tragic 64.2% |
| Bahamians | 0.6 /100 | #263 | Tragic 64.2% |
| Dutch | 0.6 /100 | #264 | Tragic 64.2% |
| Cubans | 0.5 /100 | #265 | Tragic 64.2% |
| Immigrants | England | 0.5 /100 | #266 | Tragic 64.2% |
| Canadians | 0.5 /100 | #267 | Tragic 64.1% |
| Spaniards | 0.5 /100 | #268 | Tragic 64.1% |
| Irish | 0.4 /100 | #269 | Tragic 64.1% |
| Guyanese | 0.4 /100 | #270 | Tragic 64.1% |
| Dominicans | 0.4 /100 | #271 | Tragic 64.1% |
| Native Hawaiians | 0.3 /100 | #272 | Tragic 64.1% |
| Hmong | 0.3 /100 | #273 | Tragic 64.1% |
| Immigrants | Cuba | 0.3 /100 | #274 | Tragic 64.1% |
Demographics Similar to Immigrants from South America by In Labor Force | Age > 16
In terms of in labor force | age > 16, the demographic groups most similar to Immigrants from South America are Aleut (66.0%, a difference of 0.010%), Immigrants from Cambodia (66.0%, a difference of 0.020%), Immigrants from Uruguay (66.0%, a difference of 0.020%), Immigrants from Laos (66.0%, a difference of 0.030%), and Chilean (66.0%, a difference of 0.030%).
| Demographics | Rating | Rank | In Labor Force | Age > 16 |
| South Americans | 99.4 /100 | #86 | Exceptional 66.0% |
| South American Indians | 99.4 /100 | #87 | Exceptional 66.0% |
| Bermudans | 99.3 /100 | #88 | Exceptional 66.0% |
| Immigrants | Laos | 99.2 /100 | #89 | Exceptional 66.0% |
| Chileans | 99.2 /100 | #90 | Exceptional 66.0% |
| Iranians | 99.2 /100 | #91 | Exceptional 66.0% |
| Aleuts | 99.1 /100 | #92 | Exceptional 66.0% |
| Immigrants | South America | 99.1 /100 | #93 | Exceptional 66.0% |
| Immigrants | Cambodia | 99.1 /100 | #94 | Exceptional 66.0% |
| Immigrants | Uruguay | 99.1 /100 | #95 | Exceptional 66.0% |
| Bangladeshis | 98.9 /100 | #96 | Exceptional 65.9% |
| Filipinos | 98.9 /100 | #97 | Exceptional 65.9% |
| Immigrants | Chile | 98.7 /100 | #98 | Exceptional 65.9% |
| Immigrants | Australia | 98.7 /100 | #99 | Exceptional 65.9% |
| Okinawans | 98.7 /100 | #100 | Exceptional 65.9% |