Swiss vs Immigrants from South America In Labor Force | Age > 16
COMPARE
Swiss
Immigrants from South America
In Labor Force | Age > 16
In Labor Force | Age > 16 Comparison
Swiss
Immigrants from South America
64.4%
IN LABOR FORCE | AGE > 16
2.1/ 100
METRIC RATING
247th/ 347
METRIC RANK
66.0%
IN LABOR FORCE | AGE > 16
99.1/ 100
METRIC RATING
93rd/ 347
METRIC RANK
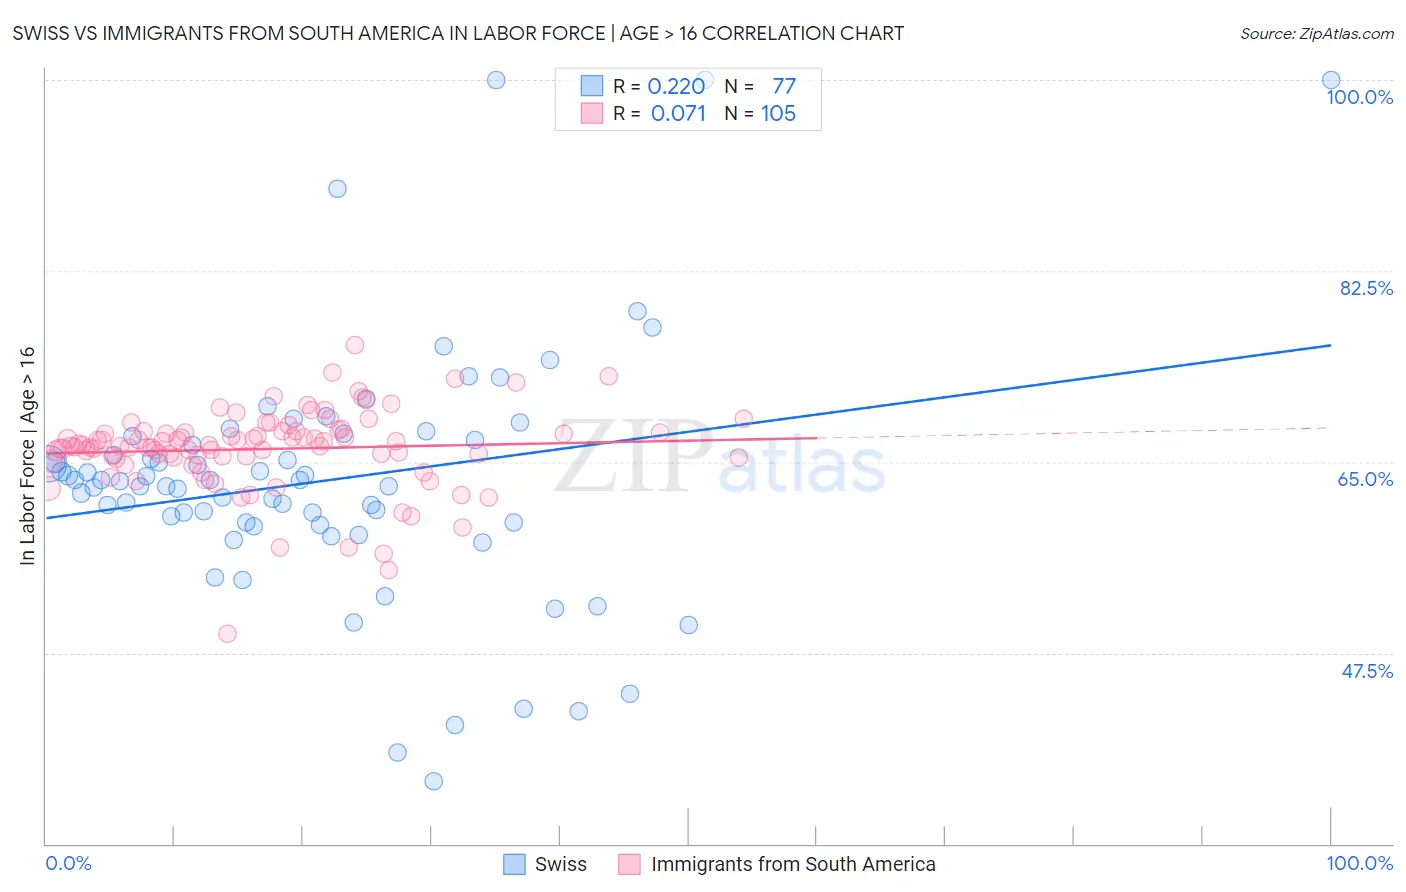
Swiss vs Immigrants from South America In Labor Force | Age > 16 Correlation Chart
The statistical analysis conducted on geographies consisting of 465,041,939 people shows a weak positive correlation between the proportion of Swiss and labor force participation rate among population ages 16 and over in the United States with a correlation coefficient (R) of 0.220 and weighted average of 64.4%. Similarly, the statistical analysis conducted on geographies consisting of 486,427,951 people shows a slight positive correlation between the proportion of Immigrants from South America and labor force participation rate among population ages 16 and over in the United States with a correlation coefficient (R) of 0.071 and weighted average of 66.0%, a difference of 2.4%.
In Labor Force | Age > 16 Correlation Summary
| Measurement | Swiss | Immigrants from South America |
| Minimum | 35.7% | 49.2% |
| Maximum | 100.0% | 75.7% |
| Range | 64.3% | 26.5% |
| Mean | 63.3% | 66.2% |
| Median | 63.3% | 66.5% |
| Interquartile 25% (IQ1) | 59.3% | 65.4% |
| Interquartile 75% (IQ3) | 67.2% | 67.8% |
| Interquartile Range (IQR) | 7.9% | 2.4% |
| Standard Deviation (Sample) | 11.6% | 3.8% |
| Standard Deviation (Population) | 11.5% | 3.8% |
Similar Demographics by In Labor Force | Age > 16
Demographics Similar to Swiss by In Labor Force | Age > 16
In terms of in labor force | age > 16, the demographic groups most similar to Swiss are Immigrants from Barbados (64.4%, a difference of 0.010%), Immigrants from Caribbean (64.4%, a difference of 0.020%), German (64.4%, a difference of 0.040%), British West Indian (64.4%, a difference of 0.050%), and Portuguese (64.4%, a difference of 0.070%).
| Demographics | Rating | Rank | In Labor Force | Age > 16 |
| Immigrants | Bangladesh | 3.6 /100 | #240 | Tragic 64.5% |
| Immigrants | Dominica | 3.5 /100 | #241 | Tragic 64.5% |
| Immigrants | Netherlands | 3.4 /100 | #242 | Tragic 64.5% |
| Immigrants | Lebanon | 3.2 /100 | #243 | Tragic 64.5% |
| Tsimshian | 3.1 /100 | #244 | Tragic 64.5% |
| West Indians | 3.0 /100 | #245 | Tragic 64.5% |
| Immigrants | Caribbean | 2.3 /100 | #246 | Tragic 64.4% |
| Swiss | 2.1 /100 | #247 | Tragic 64.4% |
| Immigrants | Barbados | 2.1 /100 | #248 | Tragic 64.4% |
| Germans | 1.8 /100 | #249 | Tragic 64.4% |
| British West Indians | 1.8 /100 | #250 | Tragic 64.4% |
| Portuguese | 1.6 /100 | #251 | Tragic 64.4% |
| Immigrants | Dominican Republic | 1.5 /100 | #252 | Tragic 64.4% |
| Czechoslovakians | 1.4 /100 | #253 | Tragic 64.3% |
| Immigrants | Uzbekistan | 1.4 /100 | #254 | Tragic 64.3% |
Demographics Similar to Immigrants from South America by In Labor Force | Age > 16
In terms of in labor force | age > 16, the demographic groups most similar to Immigrants from South America are Aleut (66.0%, a difference of 0.010%), Immigrants from Cambodia (66.0%, a difference of 0.020%), Immigrants from Uruguay (66.0%, a difference of 0.020%), Immigrants from Laos (66.0%, a difference of 0.030%), and Chilean (66.0%, a difference of 0.030%).
| Demographics | Rating | Rank | In Labor Force | Age > 16 |
| South Americans | 99.4 /100 | #86 | Exceptional 66.0% |
| South American Indians | 99.4 /100 | #87 | Exceptional 66.0% |
| Bermudans | 99.3 /100 | #88 | Exceptional 66.0% |
| Immigrants | Laos | 99.2 /100 | #89 | Exceptional 66.0% |
| Chileans | 99.2 /100 | #90 | Exceptional 66.0% |
| Iranians | 99.2 /100 | #91 | Exceptional 66.0% |
| Aleuts | 99.1 /100 | #92 | Exceptional 66.0% |
| Immigrants | South America | 99.1 /100 | #93 | Exceptional 66.0% |
| Immigrants | Cambodia | 99.1 /100 | #94 | Exceptional 66.0% |
| Immigrants | Uruguay | 99.1 /100 | #95 | Exceptional 66.0% |
| Bangladeshis | 98.9 /100 | #96 | Exceptional 65.9% |
| Filipinos | 98.9 /100 | #97 | Exceptional 65.9% |
| Immigrants | Chile | 98.7 /100 | #98 | Exceptional 65.9% |
| Immigrants | Australia | 98.7 /100 | #99 | Exceptional 65.9% |
| Okinawans | 98.7 /100 | #100 | Exceptional 65.9% |