Cuban vs Egyptian In Labor Force | Age > 16
COMPARE
Cuban
Egyptian
In Labor Force | Age > 16
In Labor Force | Age > 16 Comparison
Cubans
Egyptians
64.2%
IN LABOR FORCE | AGE > 16
0.5/ 100
METRIC RATING
265th/ 347
METRIC RANK
66.2%
IN LABOR FORCE | AGE > 16
99.8/ 100
METRIC RATING
67th/ 347
METRIC RANK
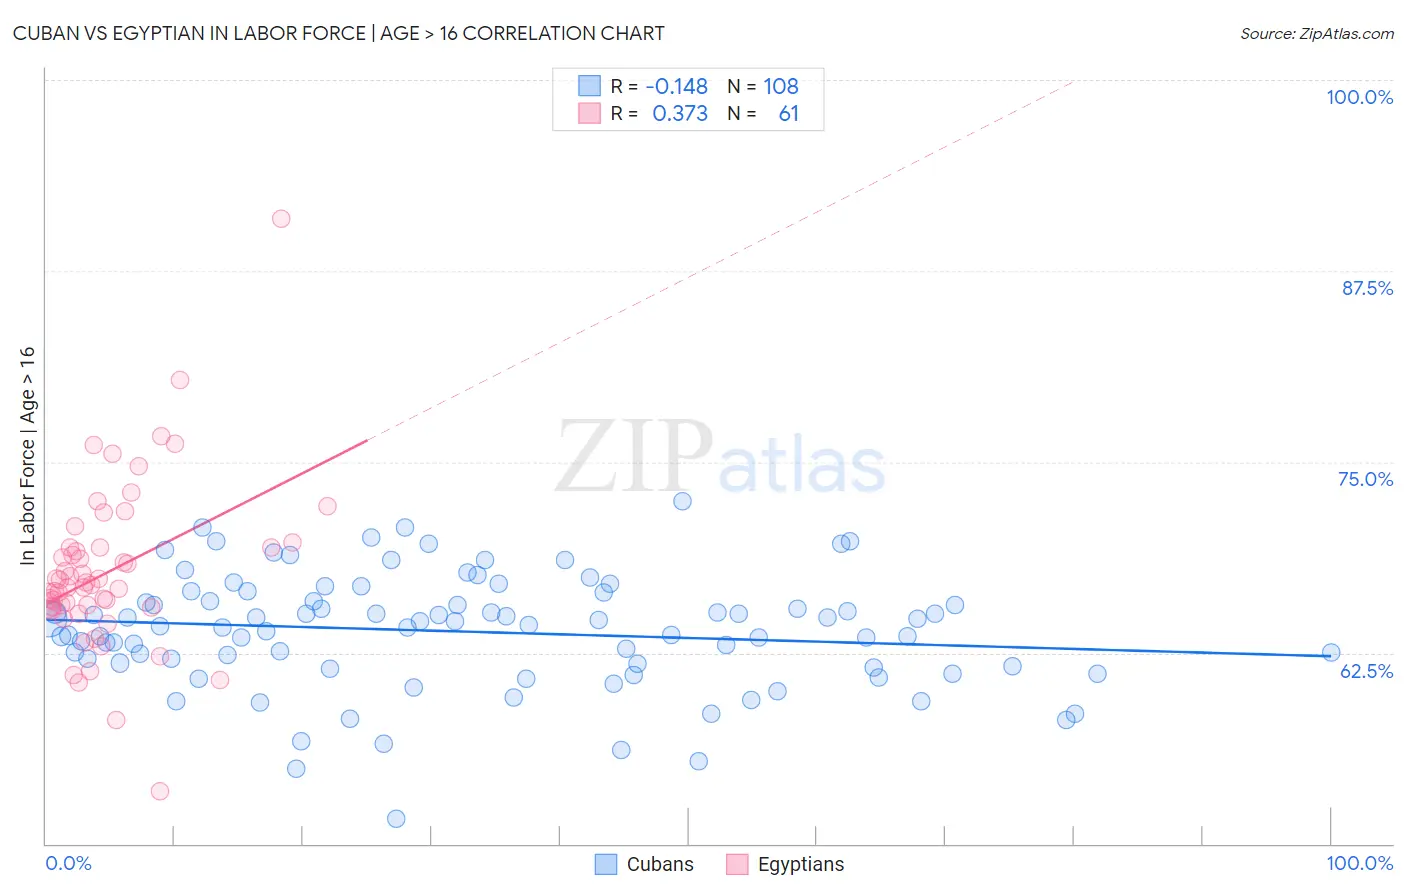
Cuban vs Egyptian In Labor Force | Age > 16 Correlation Chart
The statistical analysis conducted on geographies consisting of 449,375,303 people shows a poor negative correlation between the proportion of Cubans and labor force participation rate among population ages 16 and over in the United States with a correlation coefficient (R) of -0.148 and weighted average of 64.2%. Similarly, the statistical analysis conducted on geographies consisting of 276,931,154 people shows a mild positive correlation between the proportion of Egyptians and labor force participation rate among population ages 16 and over in the United States with a correlation coefficient (R) of 0.373 and weighted average of 66.2%, a difference of 3.2%.
In Labor Force | Age > 16 Correlation Summary
| Measurement | Cuban | Egyptian |
| Minimum | 51.6% | 53.4% |
| Maximum | 72.4% | 90.9% |
| Range | 20.8% | 37.5% |
| Mean | 63.9% | 67.8% |
| Median | 64.3% | 66.9% |
| Interquartile 25% (IQ1) | 61.7% | 65.5% |
| Interquartile 75% (IQ3) | 65.9% | 69.4% |
| Interquartile Range (IQR) | 4.2% | 3.9% |
| Standard Deviation (Sample) | 3.7% | 5.5% |
| Standard Deviation (Population) | 3.7% | 5.5% |
Similar Demographics by In Labor Force | Age > 16
Demographics Similar to Cubans by In Labor Force | Age > 16
In terms of in labor force | age > 16, the demographic groups most similar to Cubans are Immigrants from England (64.2%, a difference of 0.010%), Canadian (64.1%, a difference of 0.020%), Spaniard (64.1%, a difference of 0.020%), Dutch (64.2%, a difference of 0.040%), and Bahamian (64.2%, a difference of 0.060%).
| Demographics | Rating | Rank | In Labor Force | Age > 16 |
| Immigrants | Scotland | 0.8 /100 | #258 | Tragic 64.2% |
| Immigrants | Western Europe | 0.7 /100 | #259 | Tragic 64.2% |
| Marshallese | 0.7 /100 | #260 | Tragic 64.2% |
| Basques | 0.7 /100 | #261 | Tragic 64.2% |
| Finns | 0.7 /100 | #262 | Tragic 64.2% |
| Bahamians | 0.6 /100 | #263 | Tragic 64.2% |
| Dutch | 0.6 /100 | #264 | Tragic 64.2% |
| Cubans | 0.5 /100 | #265 | Tragic 64.2% |
| Immigrants | England | 0.5 /100 | #266 | Tragic 64.2% |
| Canadians | 0.5 /100 | #267 | Tragic 64.1% |
| Spaniards | 0.5 /100 | #268 | Tragic 64.1% |
| Irish | 0.4 /100 | #269 | Tragic 64.1% |
| Guyanese | 0.4 /100 | #270 | Tragic 64.1% |
| Dominicans | 0.4 /100 | #271 | Tragic 64.1% |
| Native Hawaiians | 0.3 /100 | #272 | Tragic 64.1% |
Demographics Similar to Egyptians by In Labor Force | Age > 16
In terms of in labor force | age > 16, the demographic groups most similar to Egyptians are Jordanian (66.3%, a difference of 0.020%), Sri Lankan (66.3%, a difference of 0.050%), Immigrants from Egypt (66.2%, a difference of 0.050%), Subsaharan African (66.2%, a difference of 0.050%), and Venezuelan (66.3%, a difference of 0.060%).
| Demographics | Rating | Rank | In Labor Force | Age > 16 |
| Immigrants | Peru | 99.8 /100 | #60 | Exceptional 66.3% |
| Immigrants | Burma/Myanmar | 99.8 /100 | #61 | Exceptional 66.3% |
| Indonesians | 99.8 /100 | #62 | Exceptional 66.3% |
| Venezuelans | 99.8 /100 | #63 | Exceptional 66.3% |
| Peruvians | 99.8 /100 | #64 | Exceptional 66.3% |
| Sri Lankans | 99.8 /100 | #65 | Exceptional 66.3% |
| Jordanians | 99.8 /100 | #66 | Exceptional 66.3% |
| Egyptians | 99.8 /100 | #67 | Exceptional 66.2% |
| Immigrants | Egypt | 99.7 /100 | #68 | Exceptional 66.2% |
| Sub-Saharan Africans | 99.7 /100 | #69 | Exceptional 66.2% |
| Asians | 99.7 /100 | #70 | Exceptional 66.2% |
| Burmese | 99.7 /100 | #71 | Exceptional 66.2% |
| Taiwanese | 99.7 /100 | #72 | Exceptional 66.2% |
| Immigrants | Vietnam | 99.7 /100 | #73 | Exceptional 66.2% |
| Immigrants | Korea | 99.7 /100 | #74 | Exceptional 66.2% |