Immigrants from Oceania vs Immigrants from Bolivia In Labor Force | Age 35-44
COMPARE
Immigrants from Oceania
Immigrants from Bolivia
In Labor Force | Age 35-44
In Labor Force | Age 35-44 Comparison
Immigrants from Oceania
Immigrants from Bolivia
83.9%
IN LABOR FORCE | AGE 35-44
2.6/ 100
METRIC RATING
234th/ 347
METRIC RANK
86.2%
IN LABOR FORCE | AGE 35-44
100.0/ 100
METRIC RATING
3rd/ 347
METRIC RANK
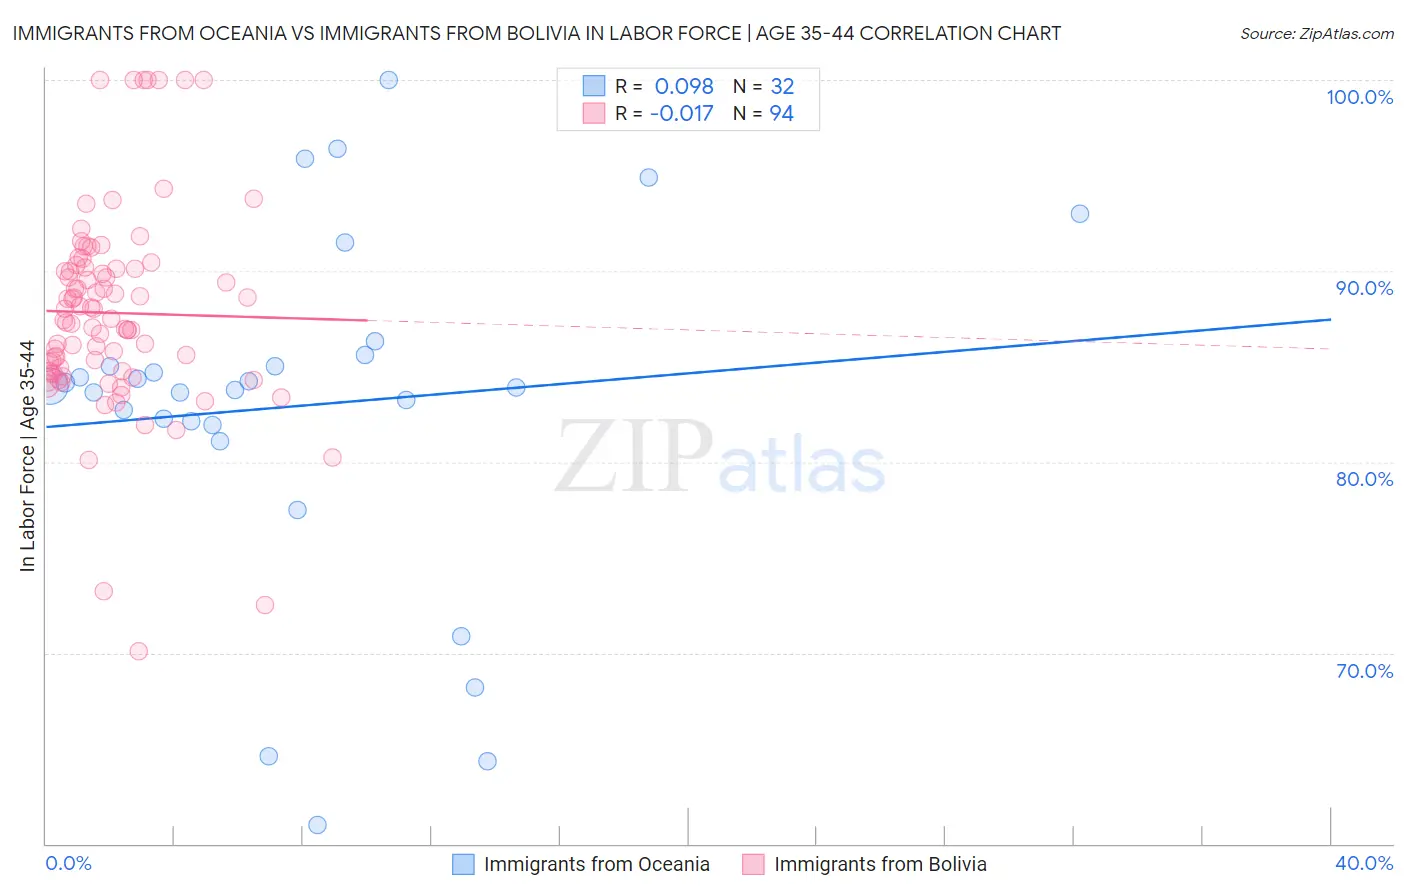
Immigrants from Oceania vs Immigrants from Bolivia In Labor Force | Age 35-44 Correlation Chart
The statistical analysis conducted on geographies consisting of 305,435,378 people shows a slight positive correlation between the proportion of Immigrants from Oceania and labor force participation rate among population between the ages 35 and 44 in the United States with a correlation coefficient (R) of 0.098 and weighted average of 83.9%. Similarly, the statistical analysis conducted on geographies consisting of 158,722,541 people shows no correlation between the proportion of Immigrants from Bolivia and labor force participation rate among population between the ages 35 and 44 in the United States with a correlation coefficient (R) of -0.017 and weighted average of 86.2%, a difference of 2.8%.
In Labor Force | Age 35-44 Correlation Summary
| Measurement | Immigrants from Oceania | Immigrants from Bolivia |
| Minimum | 61.0% | 70.1% |
| Maximum | 100.0% | 100.0% |
| Range | 39.0% | 29.9% |
| Mean | 82.9% | 87.8% |
| Median | 83.9% | 87.5% |
| Interquartile 25% (IQ1) | 82.0% | 84.7% |
| Interquartile 75% (IQ3) | 85.3% | 90.1% |
| Interquartile Range (IQR) | 3.3% | 5.4% |
| Standard Deviation (Sample) | 9.1% | 5.3% |
| Standard Deviation (Population) | 9.0% | 5.3% |
Similar Demographics by In Labor Force | Age 35-44
Demographics Similar to Immigrants from Oceania by In Labor Force | Age 35-44
In terms of in labor force | age 35-44, the demographic groups most similar to Immigrants from Oceania are Immigrants from Germany (83.9%, a difference of 0.010%), Immigrants from Syria (83.9%, a difference of 0.010%), Native Hawaiian (83.9%, a difference of 0.020%), West Indian (83.9%, a difference of 0.020%), and Scottish (83.9%, a difference of 0.030%).
| Demographics | Rating | Rank | In Labor Force | Age 35-44 |
| British West Indians | 5.3 /100 | #227 | Tragic 84.0% |
| Welsh | 5.3 /100 | #228 | Tragic 84.0% |
| Immigrants | Thailand | 4.7 /100 | #229 | Tragic 84.0% |
| Immigrants | Iraq | 3.7 /100 | #230 | Tragic 83.9% |
| Scottish | 3.2 /100 | #231 | Tragic 83.9% |
| Native Hawaiians | 3.0 /100 | #232 | Tragic 83.9% |
| Immigrants | Germany | 2.8 /100 | #233 | Tragic 83.9% |
| Immigrants | Oceania | 2.6 /100 | #234 | Tragic 83.9% |
| Immigrants | Syria | 2.5 /100 | #235 | Tragic 83.9% |
| West Indians | 2.4 /100 | #236 | Tragic 83.9% |
| English | 1.8 /100 | #237 | Tragic 83.8% |
| Immigrants | Laos | 1.7 /100 | #238 | Tragic 83.8% |
| Celtics | 1.4 /100 | #239 | Tragic 83.8% |
| Arabs | 1.3 /100 | #240 | Tragic 83.8% |
| Iraqis | 1.3 /100 | #241 | Tragic 83.8% |
Demographics Similar to Immigrants from Bolivia by In Labor Force | Age 35-44
In terms of in labor force | age 35-44, the demographic groups most similar to Immigrants from Bolivia are Immigrants from Cabo Verde (86.2%, a difference of 0.030%), Zimbabwean (86.1%, a difference of 0.16%), Bolivian (86.1%, a difference of 0.17%), Luxembourger (86.4%, a difference of 0.19%), and Sierra Leonean (86.4%, a difference of 0.21%).
| Demographics | Rating | Rank | In Labor Force | Age 35-44 |
| Sierra Leoneans | 100.0 /100 | #1 | Exceptional 86.4% |
| Luxembourgers | 100.0 /100 | #2 | Exceptional 86.4% |
| Immigrants | Bolivia | 100.0 /100 | #3 | Exceptional 86.2% |
| Immigrants | Cabo Verde | 100.0 /100 | #4 | Exceptional 86.2% |
| Zimbabweans | 100.0 /100 | #5 | Exceptional 86.1% |
| Bolivians | 100.0 /100 | #6 | Exceptional 86.1% |
| Immigrants | Sierra Leone | 100.0 /100 | #7 | Exceptional 86.1% |
| Immigrants | Ethiopia | 100.0 /100 | #8 | Exceptional 85.9% |
| Ethiopians | 100.0 /100 | #9 | Exceptional 85.9% |
| Cape Verdeans | 100.0 /100 | #10 | Exceptional 85.8% |
| Immigrants | Cameroon | 100.0 /100 | #11 | Exceptional 85.8% |
| Liberians | 100.0 /100 | #12 | Exceptional 85.7% |
| Somalis | 100.0 /100 | #13 | Exceptional 85.6% |
| Immigrants | Somalia | 100.0 /100 | #14 | Exceptional 85.6% |
| Norwegians | 100.0 /100 | #15 | Exceptional 85.6% |