Immigrants from Northern Africa vs Liberian In Labor Force | Age > 16
COMPARE
Immigrants from Northern Africa
Liberian
In Labor Force | Age > 16
In Labor Force | Age > 16 Comparison
Immigrants from Northern Africa
Liberians
66.6%
IN LABOR FORCE | AGE > 16
100.0/ 100
METRIC RATING
49th/ 347
METRIC RANK
67.8%
IN LABOR FORCE | AGE > 16
100.0/ 100
METRIC RATING
14th/ 347
METRIC RANK
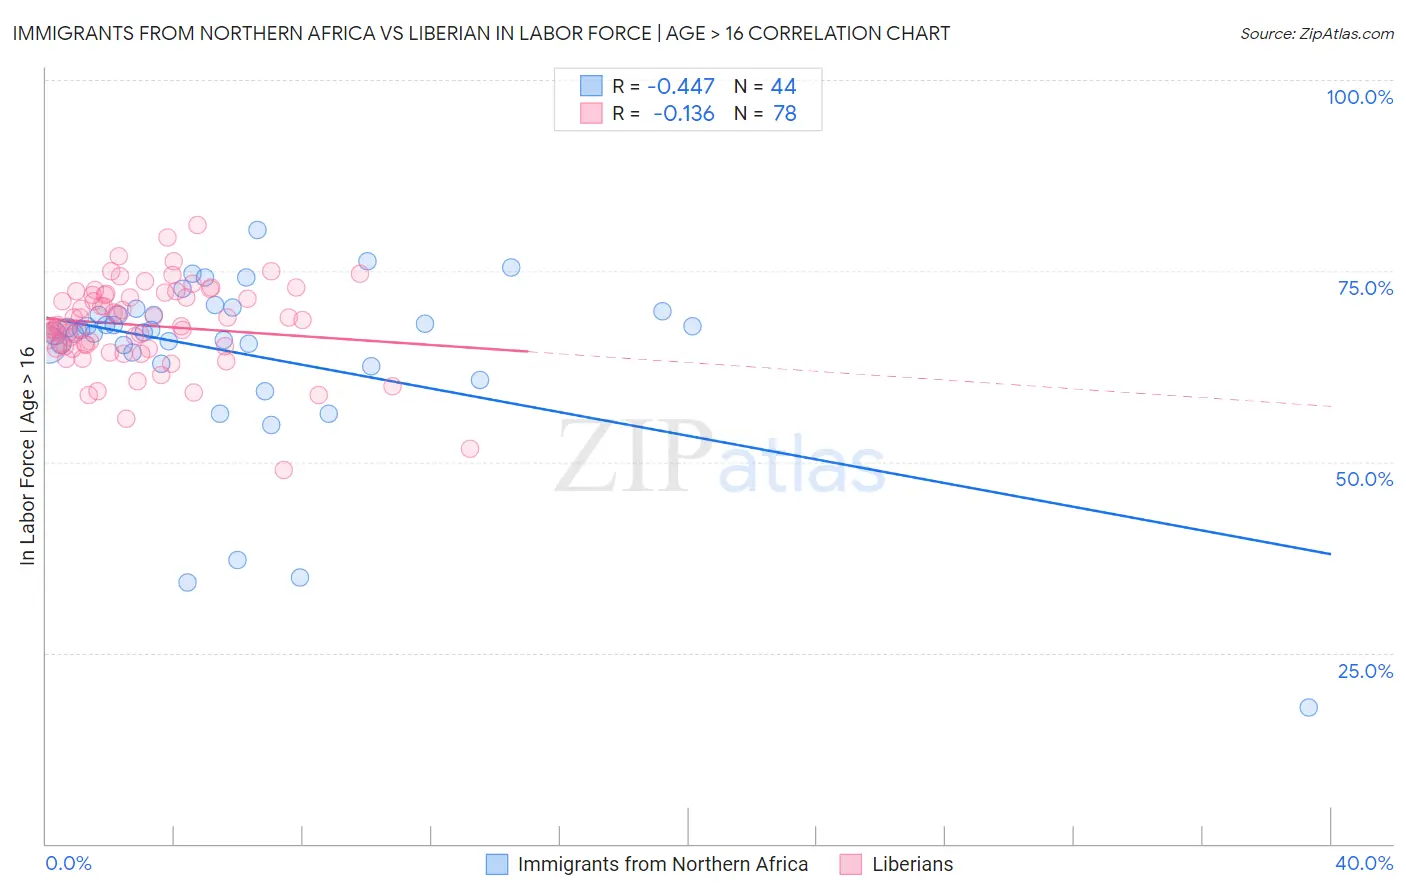
Immigrants from Northern Africa vs Liberian In Labor Force | Age > 16 Correlation Chart
The statistical analysis conducted on geographies consisting of 321,205,048 people shows a moderate negative correlation between the proportion of Immigrants from Northern Africa and labor force participation rate among population ages 16 and over in the United States with a correlation coefficient (R) of -0.447 and weighted average of 66.6%. Similarly, the statistical analysis conducted on geographies consisting of 118,097,222 people shows a poor negative correlation between the proportion of Liberians and labor force participation rate among population ages 16 and over in the United States with a correlation coefficient (R) of -0.136 and weighted average of 67.8%, a difference of 1.8%.
In Labor Force | Age > 16 Correlation Summary
| Measurement | Immigrants from Northern Africa | Liberian |
| Minimum | 17.9% | 49.0% |
| Maximum | 80.4% | 81.0% |
| Range | 62.5% | 32.0% |
| Mean | 64.1% | 67.9% |
| Median | 67.2% | 67.8% |
| Interquartile 25% (IQ1) | 63.6% | 64.8% |
| Interquartile 75% (IQ3) | 69.5% | 71.9% |
| Interquartile Range (IQR) | 5.8% | 7.1% |
| Standard Deviation (Sample) | 12.0% | 5.7% |
| Standard Deviation (Population) | 11.8% | 5.6% |
Similar Demographics by In Labor Force | Age > 16
Demographics Similar to Immigrants from Northern Africa by In Labor Force | Age > 16
In terms of in labor force | age > 16, the demographic groups most similar to Immigrants from Northern Africa are Nigerian (66.6%, a difference of 0.020%), Brazilian (66.6%, a difference of 0.030%), Immigrants from Bulgaria (66.6%, a difference of 0.030%), Cape Verdean (66.6%, a difference of 0.050%), and Immigrants from Brazil (66.7%, a difference of 0.10%).
| Demographics | Rating | Rank | In Labor Force | Age > 16 |
| Senegalese | 100.0 /100 | #42 | Exceptional 66.7% |
| Luxembourgers | 100.0 /100 | #43 | Exceptional 66.7% |
| Immigrants | Pakistan | 100.0 /100 | #44 | Exceptional 66.7% |
| Immigrants | Brazil | 100.0 /100 | #45 | Exceptional 66.7% |
| Brazilians | 100.0 /100 | #46 | Exceptional 66.6% |
| Immigrants | Bulgaria | 100.0 /100 | #47 | Exceptional 66.6% |
| Nigerians | 100.0 /100 | #48 | Exceptional 66.6% |
| Immigrants | Northern Africa | 100.0 /100 | #49 | Exceptional 66.6% |
| Cape Verdeans | 100.0 /100 | #50 | Exceptional 66.6% |
| Immigrants | Kuwait | 100.0 /100 | #51 | Exceptional 66.5% |
| Paraguayans | 99.9 /100 | #52 | Exceptional 66.5% |
| Immigrants | Sri Lanka | 99.9 /100 | #53 | Exceptional 66.5% |
| Immigrants | Bosnia and Herzegovina | 99.9 /100 | #54 | Exceptional 66.5% |
| Immigrants | Venezuela | 99.9 /100 | #55 | Exceptional 66.4% |
| Immigrants | Senegal | 99.9 /100 | #56 | Exceptional 66.4% |
Demographics Similar to Liberians by In Labor Force | Age > 16
In terms of in labor force | age > 16, the demographic groups most similar to Liberians are Immigrants from Middle Africa (67.7%, a difference of 0.050%), Immigrants from Sudan (67.7%, a difference of 0.16%), Immigrants from India (67.6%, a difference of 0.24%), Immigrants from Liberia (67.6%, a difference of 0.25%), and Kenyan (67.6%, a difference of 0.29%).
| Demographics | Rating | Rank | In Labor Force | Age > 16 |
| Immigrants | Cameroon | 100.0 /100 | #7 | Exceptional 68.7% |
| Immigrants | Sierra Leone | 100.0 /100 | #8 | Exceptional 68.5% |
| Immigrants | Eastern Africa | 100.0 /100 | #9 | Exceptional 68.5% |
| Immigrants | Bolivia | 100.0 /100 | #10 | Exceptional 68.4% |
| Bolivians | 100.0 /100 | #11 | Exceptional 68.2% |
| Sudanese | 100.0 /100 | #12 | Exceptional 68.0% |
| Immigrants | Nepal | 100.0 /100 | #13 | Exceptional 68.0% |
| Liberians | 100.0 /100 | #14 | Exceptional 67.8% |
| Immigrants | Middle Africa | 100.0 /100 | #15 | Exceptional 67.7% |
| Immigrants | Sudan | 100.0 /100 | #16 | Exceptional 67.7% |
| Immigrants | India | 100.0 /100 | #17 | Exceptional 67.6% |
| Immigrants | Liberia | 100.0 /100 | #18 | Exceptional 67.6% |
| Kenyans | 100.0 /100 | #19 | Exceptional 67.6% |
| Immigrants | Kenya | 100.0 /100 | #20 | Exceptional 67.6% |
| Tongans | 100.0 /100 | #21 | Exceptional 67.5% |