Immigrants from Northern Africa vs German In Labor Force | Age > 16
COMPARE
Immigrants from Northern Africa
German
In Labor Force | Age > 16
In Labor Force | Age > 16 Comparison
Immigrants from Northern Africa
Germans
66.6%
IN LABOR FORCE | AGE > 16
100.0/ 100
METRIC RATING
49th/ 347
METRIC RANK
64.4%
IN LABOR FORCE | AGE > 16
1.8/ 100
METRIC RATING
249th/ 347
METRIC RANK
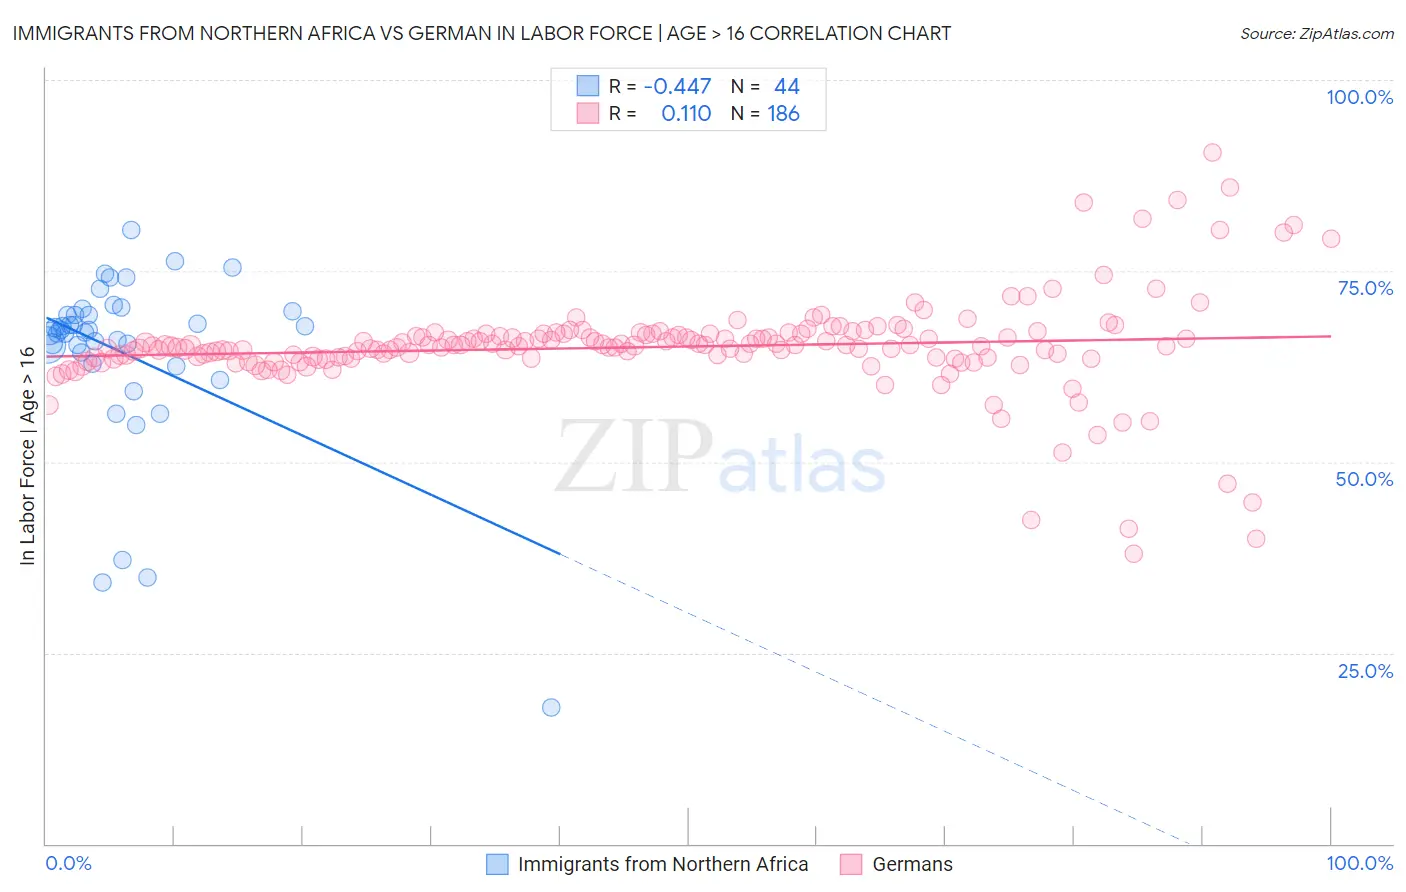
Immigrants from Northern Africa vs German In Labor Force | Age > 16 Correlation Chart
The statistical analysis conducted on geographies consisting of 321,205,048 people shows a moderate negative correlation between the proportion of Immigrants from Northern Africa and labor force participation rate among population ages 16 and over in the United States with a correlation coefficient (R) of -0.447 and weighted average of 66.6%. Similarly, the statistical analysis conducted on geographies consisting of 581,290,926 people shows a poor positive correlation between the proportion of Germans and labor force participation rate among population ages 16 and over in the United States with a correlation coefficient (R) of 0.110 and weighted average of 64.4%, a difference of 3.4%.
In Labor Force | Age > 16 Correlation Summary
| Measurement | Immigrants from Northern Africa | German |
| Minimum | 17.9% | 37.9% |
| Maximum | 80.4% | 90.5% |
| Range | 62.5% | 52.6% |
| Mean | 64.1% | 65.0% |
| Median | 67.2% | 65.1% |
| Interquartile 25% (IQ1) | 63.6% | 63.6% |
| Interquartile 75% (IQ3) | 69.5% | 66.6% |
| Interquartile Range (IQR) | 5.8% | 3.0% |
| Standard Deviation (Sample) | 12.0% | 6.5% |
| Standard Deviation (Population) | 11.8% | 6.5% |
Similar Demographics by In Labor Force | Age > 16
Demographics Similar to Immigrants from Northern Africa by In Labor Force | Age > 16
In terms of in labor force | age > 16, the demographic groups most similar to Immigrants from Northern Africa are Nigerian (66.6%, a difference of 0.020%), Brazilian (66.6%, a difference of 0.030%), Immigrants from Bulgaria (66.6%, a difference of 0.030%), Cape Verdean (66.6%, a difference of 0.050%), and Immigrants from Brazil (66.7%, a difference of 0.10%).
| Demographics | Rating | Rank | In Labor Force | Age > 16 |
| Senegalese | 100.0 /100 | #42 | Exceptional 66.7% |
| Luxembourgers | 100.0 /100 | #43 | Exceptional 66.7% |
| Immigrants | Pakistan | 100.0 /100 | #44 | Exceptional 66.7% |
| Immigrants | Brazil | 100.0 /100 | #45 | Exceptional 66.7% |
| Brazilians | 100.0 /100 | #46 | Exceptional 66.6% |
| Immigrants | Bulgaria | 100.0 /100 | #47 | Exceptional 66.6% |
| Nigerians | 100.0 /100 | #48 | Exceptional 66.6% |
| Immigrants | Northern Africa | 100.0 /100 | #49 | Exceptional 66.6% |
| Cape Verdeans | 100.0 /100 | #50 | Exceptional 66.6% |
| Immigrants | Kuwait | 100.0 /100 | #51 | Exceptional 66.5% |
| Paraguayans | 99.9 /100 | #52 | Exceptional 66.5% |
| Immigrants | Sri Lanka | 99.9 /100 | #53 | Exceptional 66.5% |
| Immigrants | Bosnia and Herzegovina | 99.9 /100 | #54 | Exceptional 66.5% |
| Immigrants | Venezuela | 99.9 /100 | #55 | Exceptional 66.4% |
| Immigrants | Senegal | 99.9 /100 | #56 | Exceptional 66.4% |
Demographics Similar to Germans by In Labor Force | Age > 16
In terms of in labor force | age > 16, the demographic groups most similar to Germans are British West Indian (64.4%, a difference of 0.010%), Immigrants from Barbados (64.4%, a difference of 0.030%), Portuguese (64.4%, a difference of 0.030%), Swiss (64.4%, a difference of 0.040%), and Immigrants from Caribbean (64.4%, a difference of 0.060%).
| Demographics | Rating | Rank | In Labor Force | Age > 16 |
| Immigrants | Netherlands | 3.4 /100 | #242 | Tragic 64.5% |
| Immigrants | Lebanon | 3.2 /100 | #243 | Tragic 64.5% |
| Tsimshian | 3.1 /100 | #244 | Tragic 64.5% |
| West Indians | 3.0 /100 | #245 | Tragic 64.5% |
| Immigrants | Caribbean | 2.3 /100 | #246 | Tragic 64.4% |
| Swiss | 2.1 /100 | #247 | Tragic 64.4% |
| Immigrants | Barbados | 2.1 /100 | #248 | Tragic 64.4% |
| Germans | 1.8 /100 | #249 | Tragic 64.4% |
| British West Indians | 1.8 /100 | #250 | Tragic 64.4% |
| Portuguese | 1.6 /100 | #251 | Tragic 64.4% |
| Immigrants | Dominican Republic | 1.5 /100 | #252 | Tragic 64.4% |
| Czechoslovakians | 1.4 /100 | #253 | Tragic 64.3% |
| Immigrants | Uzbekistan | 1.4 /100 | #254 | Tragic 64.3% |
| Hispanics or Latinos | 1.1 /100 | #255 | Tragic 64.3% |
| Immigrants | Mexico | 1.0 /100 | #256 | Tragic 64.3% |