Immigrants from Morocco vs Immigrants from Australia In Labor Force | Age 25-29
COMPARE
Immigrants from Morocco
Immigrants from Australia
In Labor Force | Age 25-29
In Labor Force | Age 25-29 Comparison
Immigrants from Morocco
Immigrants from Australia
85.5%
IN LABOR FORCE | AGE 25-29
99.5/ 100
METRIC RATING
59th/ 347
METRIC RANK
85.3%
IN LABOR FORCE | AGE 25-29
98.9/ 100
METRIC RATING
72nd/ 347
METRIC RANK
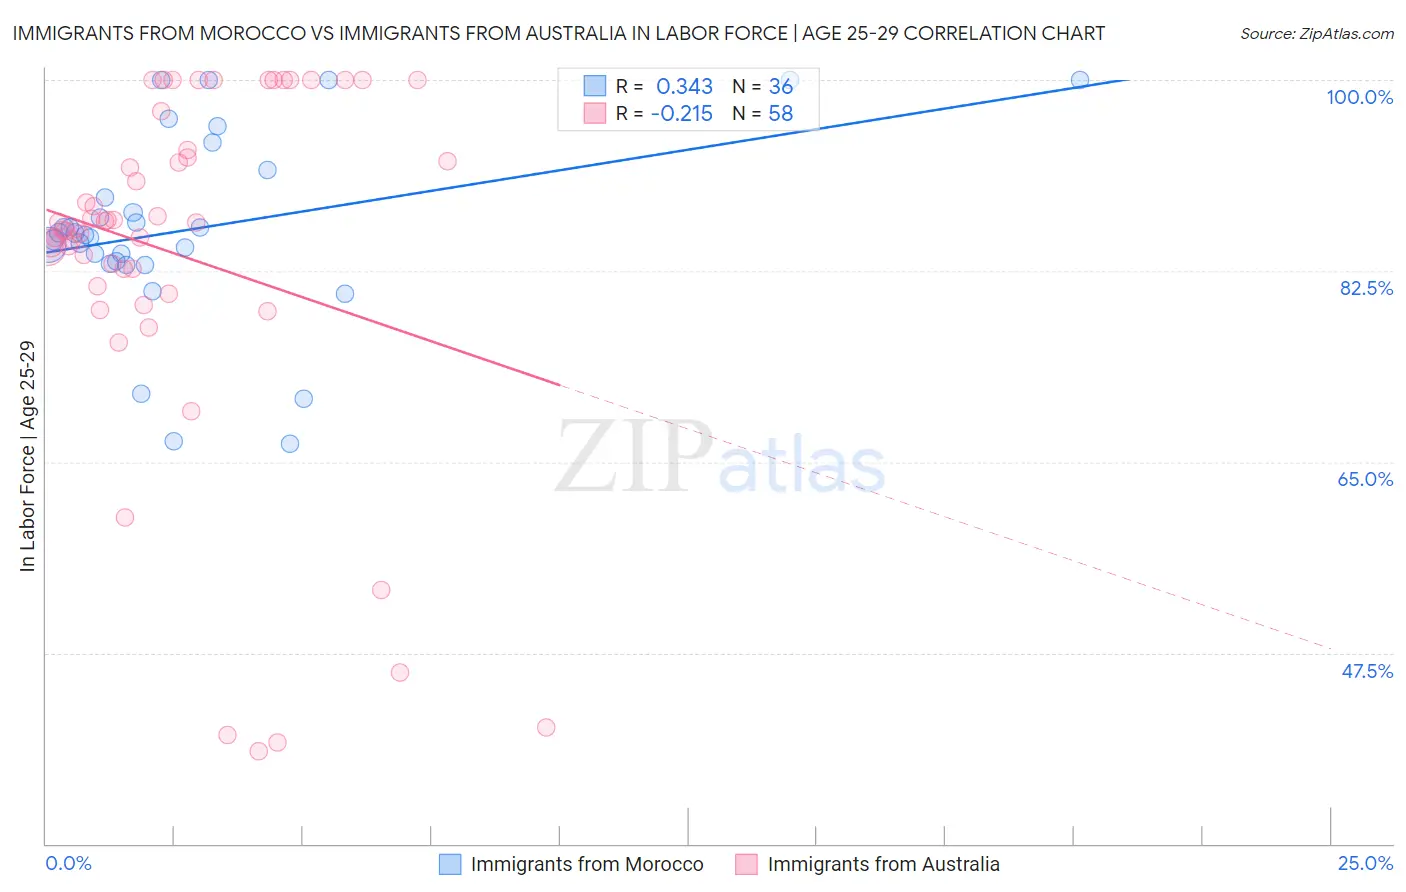
Immigrants from Morocco vs Immigrants from Australia In Labor Force | Age 25-29 Correlation Chart
The statistical analysis conducted on geographies consisting of 178,899,306 people shows a mild positive correlation between the proportion of Immigrants from Morocco and labor force participation rate among population between the ages 25 and 29 in the United States with a correlation coefficient (R) of 0.343 and weighted average of 85.5%. Similarly, the statistical analysis conducted on geographies consisting of 227,173,670 people shows a weak negative correlation between the proportion of Immigrants from Australia and labor force participation rate among population between the ages 25 and 29 in the United States with a correlation coefficient (R) of -0.215 and weighted average of 85.3%, a difference of 0.16%.
In Labor Force | Age 25-29 Correlation Summary
| Measurement | Immigrants from Morocco | Immigrants from Australia |
| Minimum | 66.7% | 38.5% |
| Maximum | 100.0% | 100.0% |
| Range | 33.3% | 61.5% |
| Mean | 86.4% | 83.9% |
| Median | 85.9% | 86.6% |
| Interquartile 25% (IQ1) | 83.3% | 81.1% |
| Interquartile 75% (IQ3) | 90.5% | 93.5% |
| Interquartile Range (IQR) | 7.2% | 12.5% |
| Standard Deviation (Sample) | 8.6% | 16.4% |
| Standard Deviation (Population) | 8.5% | 16.3% |
Demographics Similar to Immigrants from Morocco and Immigrants from Australia by In Labor Force | Age 25-29
In terms of in labor force | age 25-29, the demographic groups most similar to Immigrants from Morocco are Estonian (85.5%, a difference of 0.010%), Greek (85.5%, a difference of 0.010%), Eastern European (85.5%, a difference of 0.020%), Thai (85.5%, a difference of 0.030%), and Serbian (85.5%, a difference of 0.030%). Similarly, the demographic groups most similar to Immigrants from Australia are Russian (85.3%, a difference of 0.010%), Kenyan (85.4%, a difference of 0.020%), Menominee (85.4%, a difference of 0.040%), Immigrants from Sweden (85.4%, a difference of 0.040%), and Soviet Union (85.3%, a difference of 0.050%).
| Demographics | Rating | Rank | In Labor Force | Age 25-29 |
| Immigrants | Brazil | 99.7 /100 | #55 | Exceptional 85.5% |
| Eastern Europeans | 99.6 /100 | #56 | Exceptional 85.5% |
| Estonians | 99.6 /100 | #57 | Exceptional 85.5% |
| Greeks | 99.6 /100 | #58 | Exceptional 85.5% |
| Immigrants | Morocco | 99.5 /100 | #59 | Exceptional 85.5% |
| Thais | 99.5 /100 | #60 | Exceptional 85.5% |
| Serbians | 99.5 /100 | #61 | Exceptional 85.5% |
| Taiwanese | 99.4 /100 | #62 | Exceptional 85.4% |
| Immigrants | Kenya | 99.4 /100 | #63 | Exceptional 85.4% |
| Immigrants | Italy | 99.3 /100 | #64 | Exceptional 85.4% |
| Immigrants | Czechoslovakia | 99.3 /100 | #65 | Exceptional 85.4% |
| Immigrants | Scotland | 99.3 /100 | #66 | Exceptional 85.4% |
| Immigrants | Turkey | 99.2 /100 | #67 | Exceptional 85.4% |
| Immigrants | Cameroon | 99.2 /100 | #68 | Exceptional 85.4% |
| Menominee | 99.1 /100 | #69 | Exceptional 85.4% |
| Immigrants | Sweden | 99.1 /100 | #70 | Exceptional 85.4% |
| Kenyans | 99.0 /100 | #71 | Exceptional 85.4% |
| Immigrants | Australia | 98.9 /100 | #72 | Exceptional 85.3% |
| Russians | 98.8 /100 | #73 | Exceptional 85.3% |
| Soviet Union | 98.5 /100 | #74 | Exceptional 85.3% |
| Brazilians | 98.3 /100 | #75 | Exceptional 85.3% |