Swedish vs Immigrants from Guatemala In Labor Force | Age 30-34
COMPARE
Swedish
Immigrants from Guatemala
In Labor Force | Age 30-34
In Labor Force | Age 30-34 Comparison
Swedes
Immigrants from Guatemala
85.2%
IN LABOR FORCE | AGE 30-34
97.5/ 100
METRIC RATING
94th/ 347
METRIC RANK
83.7%
IN LABOR FORCE | AGE 30-34
0.1/ 100
METRIC RATING
266th/ 347
METRIC RANK
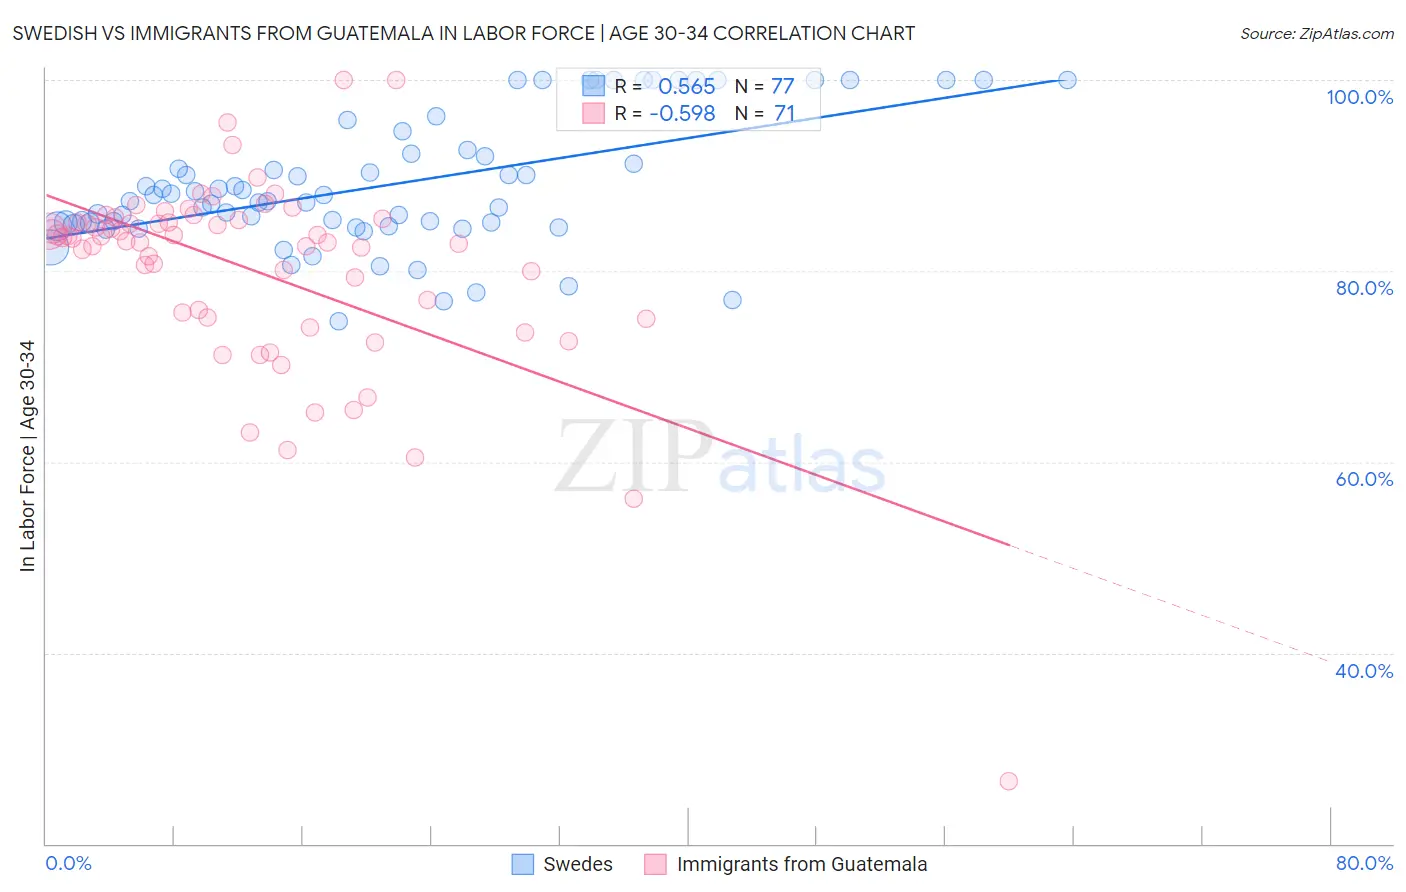
Swedish vs Immigrants from Guatemala In Labor Force | Age 30-34 Correlation Chart
The statistical analysis conducted on geographies consisting of 538,314,811 people shows a substantial positive correlation between the proportion of Swedes and labor force participation rate among population between the ages 30 and 34 in the United States with a correlation coefficient (R) of 0.565 and weighted average of 85.2%. Similarly, the statistical analysis conducted on geographies consisting of 377,154,484 people shows a substantial negative correlation between the proportion of Immigrants from Guatemala and labor force participation rate among population between the ages 30 and 34 in the United States with a correlation coefficient (R) of -0.598 and weighted average of 83.7%, a difference of 1.8%.
In Labor Force | Age 30-34 Correlation Summary
| Measurement | Swedish | Immigrants from Guatemala |
| Minimum | 74.7% | 26.6% |
| Maximum | 100.0% | 100.0% |
| Range | 25.3% | 73.4% |
| Mean | 89.0% | 80.1% |
| Median | 87.3% | 83.5% |
| Interquartile 25% (IQ1) | 84.8% | 75.1% |
| Interquartile 75% (IQ3) | 92.5% | 85.3% |
| Interquartile Range (IQR) | 7.7% | 10.2% |
| Standard Deviation (Sample) | 6.8% | 10.6% |
| Standard Deviation (Population) | 6.7% | 10.6% |
Similar Demographics by In Labor Force | Age 30-34
Demographics Similar to Swedes by In Labor Force | Age 30-34
In terms of in labor force | age 30-34, the demographic groups most similar to Swedes are Immigrants from India (85.2%, a difference of 0.0%), Immigrants from Norway (85.2%, a difference of 0.010%), Immigrants from Korea (85.2%, a difference of 0.010%), German Russian (85.2%, a difference of 0.020%), and Thai (85.2%, a difference of 0.020%).
| Demographics | Rating | Rank | In Labor Force | Age 30-34 |
| Immigrants | Northern Europe | 98.2 /100 | #87 | Exceptional 85.3% |
| Immigrants | Belgium | 98.2 /100 | #88 | Exceptional 85.3% |
| Immigrants | Kazakhstan | 98.1 /100 | #89 | Exceptional 85.3% |
| Burmese | 97.9 /100 | #90 | Exceptional 85.3% |
| Immigrants | Moldova | 97.9 /100 | #91 | Exceptional 85.3% |
| German Russians | 97.7 /100 | #92 | Exceptional 85.2% |
| Immigrants | Norway | 97.6 /100 | #93 | Exceptional 85.2% |
| Swedes | 97.5 /100 | #94 | Exceptional 85.2% |
| Immigrants | India | 97.4 /100 | #95 | Exceptional 85.2% |
| Immigrants | Korea | 97.3 /100 | #96 | Exceptional 85.2% |
| Thais | 97.2 /100 | #97 | Exceptional 85.2% |
| Immigrants | Uganda | 97.2 /100 | #98 | Exceptional 85.2% |
| Belgians | 97.2 /100 | #99 | Exceptional 85.2% |
| Sudanese | 97.1 /100 | #100 | Exceptional 85.2% |
| Immigrants | Belarus | 96.9 /100 | #101 | Exceptional 85.2% |
Demographics Similar to Immigrants from Guatemala by In Labor Force | Age 30-34
In terms of in labor force | age 30-34, the demographic groups most similar to Immigrants from Guatemala are Immigrants from Honduras (83.7%, a difference of 0.020%), Guatemalan (83.7%, a difference of 0.050%), Immigrants from Guyana (83.8%, a difference of 0.090%), Dominican (83.8%, a difference of 0.10%), and Spaniard (83.6%, a difference of 0.10%).
| Demographics | Rating | Rank | In Labor Force | Age 30-34 |
| Scotch-Irish | 0.3 /100 | #259 | Tragic 83.8% |
| Immigrants | Dominican Republic | 0.3 /100 | #260 | Tragic 83.8% |
| Guyanese | 0.3 /100 | #261 | Tragic 83.8% |
| Dominicans | 0.2 /100 | #262 | Tragic 83.8% |
| Immigrants | Guyana | 0.2 /100 | #263 | Tragic 83.8% |
| Guatemalans | 0.2 /100 | #264 | Tragic 83.7% |
| Immigrants | Honduras | 0.1 /100 | #265 | Tragic 83.7% |
| Immigrants | Guatemala | 0.1 /100 | #266 | Tragic 83.7% |
| Spaniards | 0.1 /100 | #267 | Tragic 83.6% |
| Immigrants | Bangladesh | 0.1 /100 | #268 | Tragic 83.6% |
| Vietnamese | 0.1 /100 | #269 | Tragic 83.6% |
| Spanish Americans | 0.0 /100 | #270 | Tragic 83.5% |
| Spanish | 0.0 /100 | #271 | Tragic 83.5% |
| Immigrants | Nonimmigrants | 0.0 /100 | #272 | Tragic 83.5% |
| Guamanians/Chamorros | 0.0 /100 | #273 | Tragic 83.5% |