Fijian vs Immigrants from Guatemala In Labor Force | Age 30-34
COMPARE
Fijian
Immigrants from Guatemala
In Labor Force | Age 30-34
In Labor Force | Age 30-34 Comparison
Fijians
Immigrants from Guatemala
83.4%
IN LABOR FORCE | AGE 30-34
0.0/ 100
METRIC RATING
278th/ 347
METRIC RANK
83.7%
IN LABOR FORCE | AGE 30-34
0.1/ 100
METRIC RATING
266th/ 347
METRIC RANK
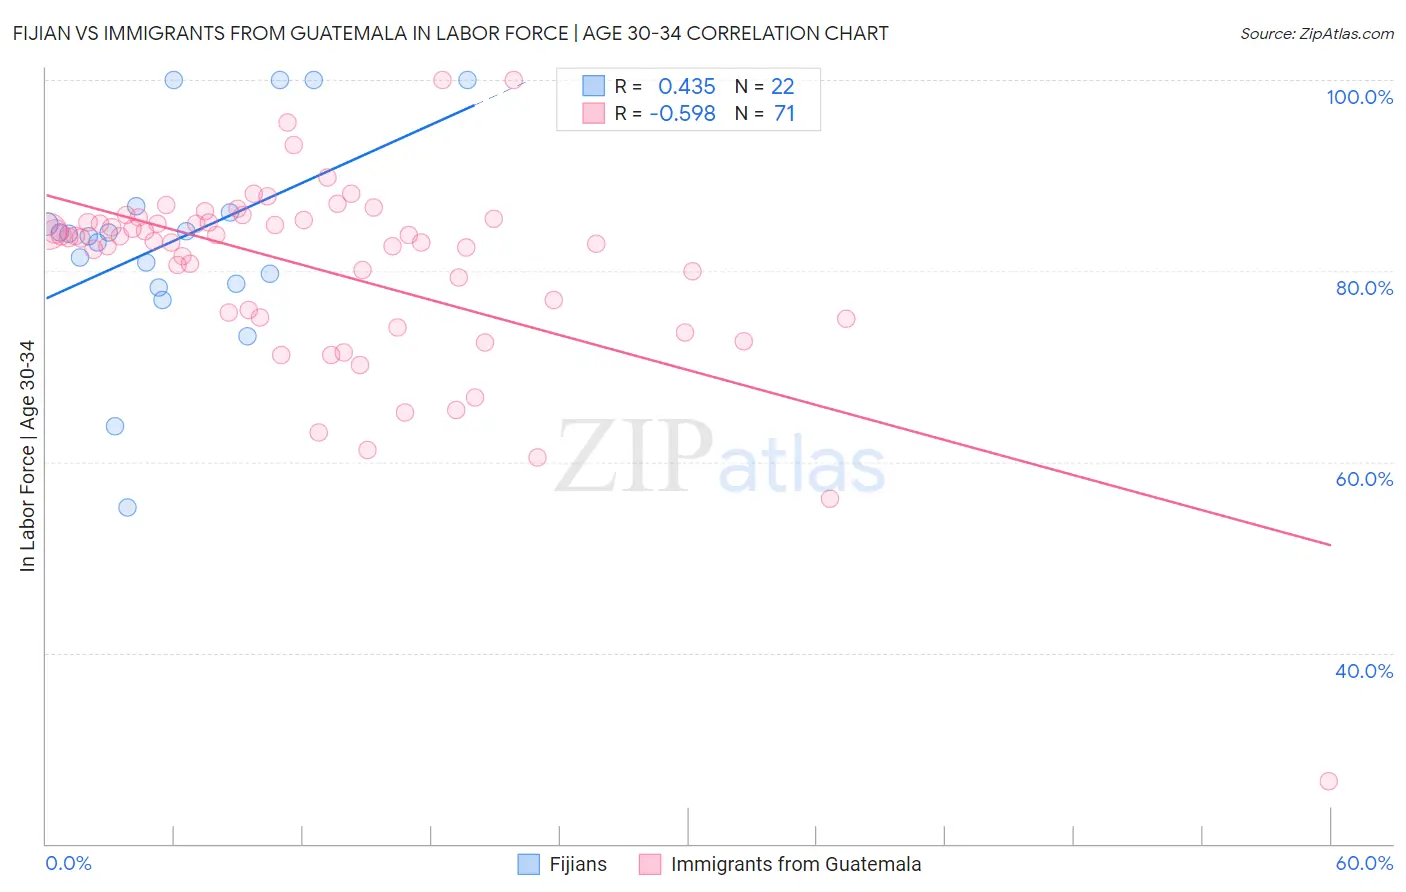
Fijian vs Immigrants from Guatemala In Labor Force | Age 30-34 Correlation Chart
The statistical analysis conducted on geographies consisting of 55,946,113 people shows a moderate positive correlation between the proportion of Fijians and labor force participation rate among population between the ages 30 and 34 in the United States with a correlation coefficient (R) of 0.435 and weighted average of 83.4%. Similarly, the statistical analysis conducted on geographies consisting of 377,154,484 people shows a substantial negative correlation between the proportion of Immigrants from Guatemala and labor force participation rate among population between the ages 30 and 34 in the United States with a correlation coefficient (R) of -0.598 and weighted average of 83.7%, a difference of 0.34%.
In Labor Force | Age 30-34 Correlation Summary
| Measurement | Fijian | Immigrants from Guatemala |
| Minimum | 55.2% | 26.6% |
| Maximum | 100.0% | 100.0% |
| Range | 44.8% | 73.4% |
| Mean | 83.1% | 80.1% |
| Median | 83.8% | 83.5% |
| Interquartile 25% (IQ1) | 78.7% | 75.1% |
| Interquartile 75% (IQ3) | 86.1% | 85.3% |
| Interquartile Range (IQR) | 7.4% | 10.2% |
| Standard Deviation (Sample) | 11.0% | 10.6% |
| Standard Deviation (Population) | 10.7% | 10.6% |
Demographics Similar to Fijians and Immigrants from Guatemala by In Labor Force | Age 30-34
In terms of in labor force | age 30-34, the demographic groups most similar to Fijians are Immigrants from Fiji (83.4%, a difference of 0.010%), African (83.4%, a difference of 0.040%), Delaware (83.5%, a difference of 0.050%), Tongan (83.5%, a difference of 0.070%), and Immigrants from Grenada (83.5%, a difference of 0.080%). Similarly, the demographic groups most similar to Immigrants from Guatemala are Immigrants from Honduras (83.7%, a difference of 0.020%), Guatemalan (83.7%, a difference of 0.050%), Immigrants from Guyana (83.8%, a difference of 0.090%), Dominican (83.8%, a difference of 0.10%), and Spaniard (83.6%, a difference of 0.10%).
| Demographics | Rating | Rank | In Labor Force | Age 30-34 |
| Dominicans | 0.2 /100 | #262 | Tragic 83.8% |
| Immigrants | Guyana | 0.2 /100 | #263 | Tragic 83.8% |
| Guatemalans | 0.2 /100 | #264 | Tragic 83.7% |
| Immigrants | Honduras | 0.1 /100 | #265 | Tragic 83.7% |
| Immigrants | Guatemala | 0.1 /100 | #266 | Tragic 83.7% |
| Spaniards | 0.1 /100 | #267 | Tragic 83.6% |
| Immigrants | Bangladesh | 0.1 /100 | #268 | Tragic 83.6% |
| Vietnamese | 0.1 /100 | #269 | Tragic 83.6% |
| Spanish Americans | 0.0 /100 | #270 | Tragic 83.5% |
| Spanish | 0.0 /100 | #271 | Tragic 83.5% |
| Immigrants | Nonimmigrants | 0.0 /100 | #272 | Tragic 83.5% |
| Guamanians/Chamorros | 0.0 /100 | #273 | Tragic 83.5% |
| Belizeans | 0.0 /100 | #274 | Tragic 83.5% |
| Immigrants | Grenada | 0.0 /100 | #275 | Tragic 83.5% |
| Tongans | 0.0 /100 | #276 | Tragic 83.5% |
| Delaware | 0.0 /100 | #277 | Tragic 83.5% |
| Fijians | 0.0 /100 | #278 | Tragic 83.4% |
| Immigrants | Fiji | 0.0 /100 | #279 | Tragic 83.4% |
| Africans | 0.0 /100 | #280 | Tragic 83.4% |
| Samoans | 0.0 /100 | #281 | Tragic 83.3% |
| Mexican American Indians | 0.0 /100 | #282 | Tragic 83.2% |