Hispanic or Latino vs Immigrants from Guatemala In Labor Force | Age 30-34
COMPARE
Hispanic or Latino
Immigrants from Guatemala
In Labor Force | Age 30-34
In Labor Force | Age 30-34 Comparison
Hispanics or Latinos
Immigrants from Guatemala
82.4%
IN LABOR FORCE | AGE 30-34
0.0/ 100
METRIC RATING
301st/ 347
METRIC RANK
83.7%
IN LABOR FORCE | AGE 30-34
0.1/ 100
METRIC RATING
266th/ 347
METRIC RANK
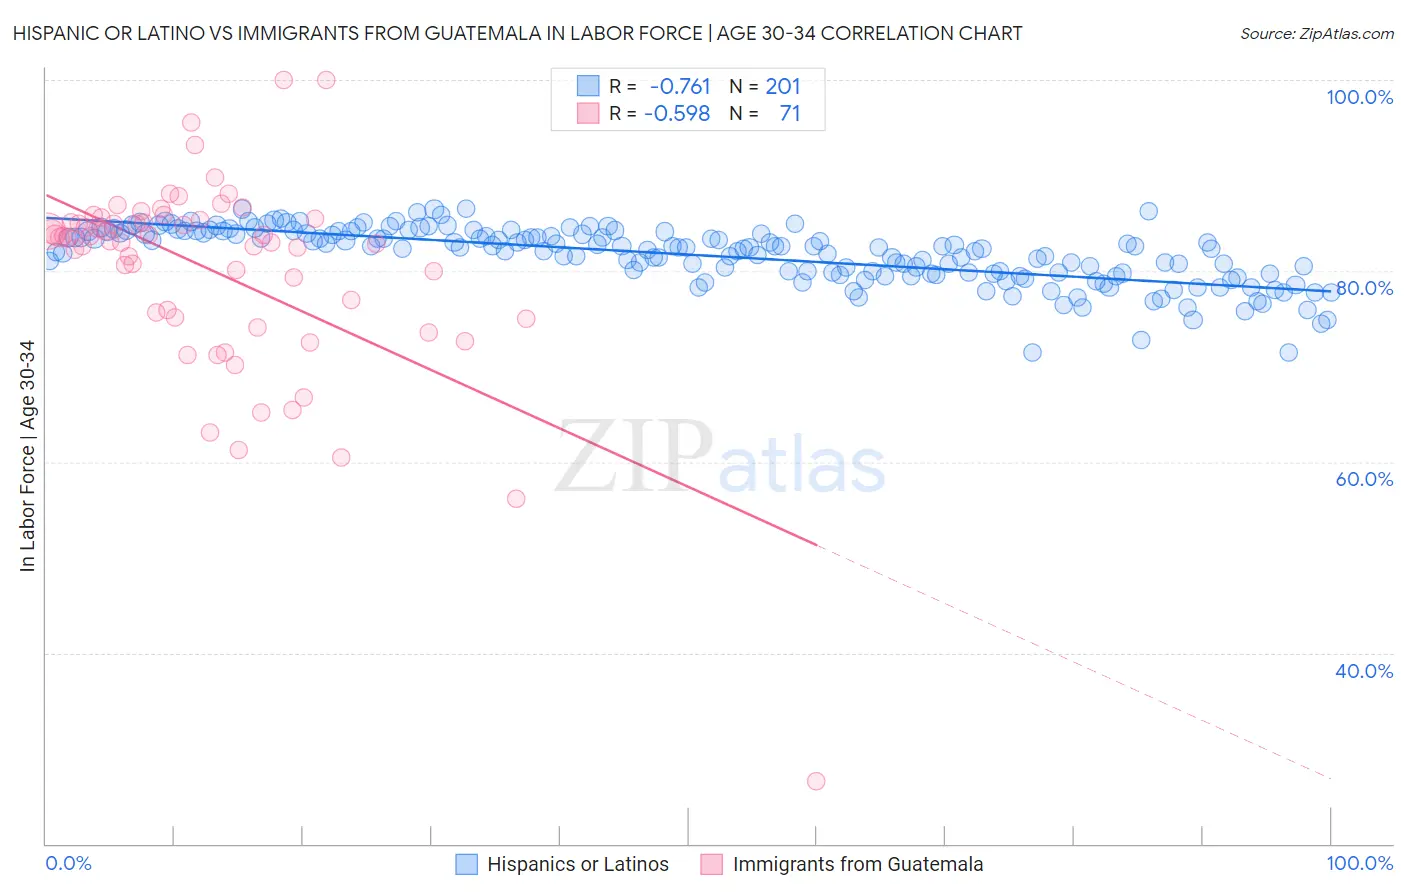
Hispanic or Latino vs Immigrants from Guatemala In Labor Force | Age 30-34 Correlation Chart
The statistical analysis conducted on geographies consisting of 576,977,639 people shows a strong negative correlation between the proportion of Hispanics or Latinos and labor force participation rate among population between the ages 30 and 34 in the United States with a correlation coefficient (R) of -0.761 and weighted average of 82.4%. Similarly, the statistical analysis conducted on geographies consisting of 377,154,484 people shows a substantial negative correlation between the proportion of Immigrants from Guatemala and labor force participation rate among population between the ages 30 and 34 in the United States with a correlation coefficient (R) of -0.598 and weighted average of 83.7%, a difference of 1.5%.
In Labor Force | Age 30-34 Correlation Summary
| Measurement | Hispanic or Latino | Immigrants from Guatemala |
| Minimum | 71.5% | 26.6% |
| Maximum | 86.5% | 100.0% |
| Range | 15.0% | 73.4% |
| Mean | 81.7% | 80.1% |
| Median | 82.4% | 83.5% |
| Interquartile 25% (IQ1) | 79.8% | 75.1% |
| Interquartile 75% (IQ3) | 84.0% | 85.3% |
| Interquartile Range (IQR) | 4.3% | 10.2% |
| Standard Deviation (Sample) | 2.9% | 10.6% |
| Standard Deviation (Population) | 2.9% | 10.6% |
Similar Demographics by In Labor Force | Age 30-34
Demographics Similar to Hispanics or Latinos by In Labor Force | Age 30-34
In terms of in labor force | age 30-34, the demographic groups most similar to Hispanics or Latinos are Hmong (82.4%, a difference of 0.010%), Ottawa (82.4%, a difference of 0.030%), Immigrants from Micronesia (82.4%, a difference of 0.040%), Immigrants from Central America (82.5%, a difference of 0.070%), and Tlingit-Haida (82.3%, a difference of 0.12%).
| Demographics | Rating | Rank | In Labor Force | Age 30-34 |
| Americans | 0.0 /100 | #294 | Tragic 82.7% |
| Pennsylvania Germans | 0.0 /100 | #295 | Tragic 82.6% |
| Chippewa | 0.0 /100 | #296 | Tragic 82.6% |
| Comanche | 0.0 /100 | #297 | Tragic 82.6% |
| Aleuts | 0.0 /100 | #298 | Tragic 82.6% |
| Immigrants | Central America | 0.0 /100 | #299 | Tragic 82.5% |
| Hmong | 0.0 /100 | #300 | Tragic 82.4% |
| Hispanics or Latinos | 0.0 /100 | #301 | Tragic 82.4% |
| Ottawa | 0.0 /100 | #302 | Tragic 82.4% |
| Immigrants | Micronesia | 0.0 /100 | #303 | Tragic 82.4% |
| Tlingit-Haida | 0.0 /100 | #304 | Tragic 82.3% |
| Osage | 0.0 /100 | #305 | Tragic 82.3% |
| Spanish American Indians | 0.0 /100 | #306 | Tragic 82.2% |
| Menominee | 0.0 /100 | #307 | Tragic 82.2% |
| Puget Sound Salish | 0.0 /100 | #308 | Tragic 82.1% |
Demographics Similar to Immigrants from Guatemala by In Labor Force | Age 30-34
In terms of in labor force | age 30-34, the demographic groups most similar to Immigrants from Guatemala are Immigrants from Honduras (83.7%, a difference of 0.020%), Guatemalan (83.7%, a difference of 0.050%), Immigrants from Guyana (83.8%, a difference of 0.090%), Dominican (83.8%, a difference of 0.10%), and Spaniard (83.6%, a difference of 0.10%).
| Demographics | Rating | Rank | In Labor Force | Age 30-34 |
| Scotch-Irish | 0.3 /100 | #259 | Tragic 83.8% |
| Immigrants | Dominican Republic | 0.3 /100 | #260 | Tragic 83.8% |
| Guyanese | 0.3 /100 | #261 | Tragic 83.8% |
| Dominicans | 0.2 /100 | #262 | Tragic 83.8% |
| Immigrants | Guyana | 0.2 /100 | #263 | Tragic 83.8% |
| Guatemalans | 0.2 /100 | #264 | Tragic 83.7% |
| Immigrants | Honduras | 0.1 /100 | #265 | Tragic 83.7% |
| Immigrants | Guatemala | 0.1 /100 | #266 | Tragic 83.7% |
| Spaniards | 0.1 /100 | #267 | Tragic 83.6% |
| Immigrants | Bangladesh | 0.1 /100 | #268 | Tragic 83.6% |
| Vietnamese | 0.1 /100 | #269 | Tragic 83.6% |
| Spanish Americans | 0.0 /100 | #270 | Tragic 83.5% |
| Spanish | 0.0 /100 | #271 | Tragic 83.5% |
| Immigrants | Nonimmigrants | 0.0 /100 | #272 | Tragic 83.5% |
| Guamanians/Chamorros | 0.0 /100 | #273 | Tragic 83.5% |