Immigrants from Ethiopia vs Immigrants from Ecuador In Labor Force | Age 20-24
COMPARE
Immigrants from Ethiopia
Immigrants from Ecuador
In Labor Force | Age 20-24
In Labor Force | Age 20-24 Comparison
Immigrants from Ethiopia
Immigrants from Ecuador
77.5%
IN LABOR FORCE | AGE 20-24
100.0/ 100
METRIC RATING
33rd/ 347
METRIC RANK
72.3%
IN LABOR FORCE | AGE 20-24
0.0/ 100
METRIC RATING
307th/ 347
METRIC RANK
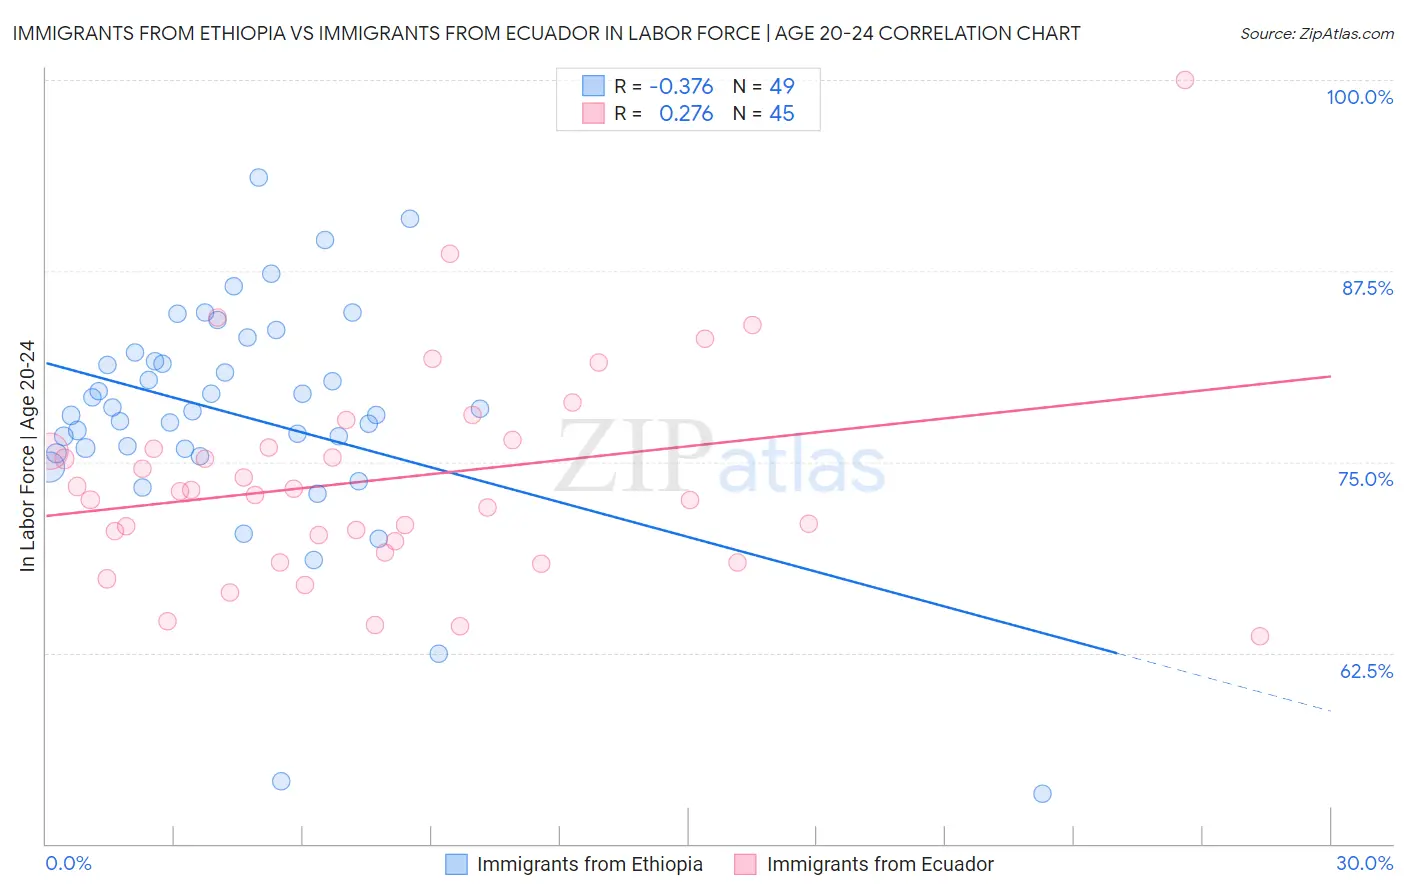
Immigrants from Ethiopia vs Immigrants from Ecuador In Labor Force | Age 20-24 Correlation Chart
The statistical analysis conducted on geographies consisting of 211,552,880 people shows a mild negative correlation between the proportion of Immigrants from Ethiopia and labor force participation rate among population between the ages 20 and 24 in the United States with a correlation coefficient (R) of -0.376 and weighted average of 77.5%. Similarly, the statistical analysis conducted on geographies consisting of 270,992,575 people shows a weak positive correlation between the proportion of Immigrants from Ecuador and labor force participation rate among population between the ages 20 and 24 in the United States with a correlation coefficient (R) of 0.276 and weighted average of 72.3%, a difference of 7.3%.
In Labor Force | Age 20-24 Correlation Summary
| Measurement | Immigrants from Ethiopia | Immigrants from Ecuador |
| Minimum | 53.3% | 63.6% |
| Maximum | 93.6% | 100.0% |
| Range | 40.3% | 36.4% |
| Mean | 78.0% | 73.9% |
| Median | 78.3% | 73.1% |
| Interquartile 25% (IQ1) | 75.7% | 69.4% |
| Interquartile 75% (IQ3) | 81.9% | 76.2% |
| Interquartile Range (IQR) | 6.2% | 6.7% |
| Standard Deviation (Sample) | 7.6% | 7.0% |
| Standard Deviation (Population) | 7.5% | 6.9% |
Similar Demographics by In Labor Force | Age 20-24
Demographics Similar to Immigrants from Ethiopia by In Labor Force | Age 20-24
In terms of in labor force | age 20-24, the demographic groups most similar to Immigrants from Ethiopia are German Russian (77.5%, a difference of 0.010%), Immigrants from Eastern Africa (77.5%, a difference of 0.020%), Welsh (77.5%, a difference of 0.040%), English (77.6%, a difference of 0.050%), and Czechoslovakian (77.5%, a difference of 0.050%).
| Demographics | Rating | Rank | In Labor Force | Age 20-24 |
| Tongans | 100.0 /100 | #26 | Exceptional 77.9% |
| Immigrants | Micronesia | 100.0 /100 | #27 | Exceptional 77.8% |
| Belgians | 100.0 /100 | #28 | Exceptional 77.8% |
| Slovaks | 100.0 /100 | #29 | Exceptional 77.7% |
| Swiss | 100.0 /100 | #30 | Exceptional 77.7% |
| Poles | 100.0 /100 | #31 | Exceptional 77.6% |
| English | 100.0 /100 | #32 | Exceptional 77.6% |
| Immigrants | Ethiopia | 100.0 /100 | #33 | Exceptional 77.5% |
| German Russians | 100.0 /100 | #34 | Exceptional 77.5% |
| Immigrants | Eastern Africa | 100.0 /100 | #35 | Exceptional 77.5% |
| Welsh | 100.0 /100 | #36 | Exceptional 77.5% |
| Czechoslovakians | 100.0 /100 | #37 | Exceptional 77.5% |
| Marshallese | 100.0 /100 | #38 | Exceptional 77.4% |
| Irish | 100.0 /100 | #39 | Exceptional 77.4% |
| Scottish | 100.0 /100 | #40 | Exceptional 77.4% |
Demographics Similar to Immigrants from Ecuador by In Labor Force | Age 20-24
In terms of in labor force | age 20-24, the demographic groups most similar to Immigrants from Ecuador are Soviet Union (72.3%, a difference of 0.010%), Tsimshian (72.3%, a difference of 0.010%), Immigrants from Jamaica (72.4%, a difference of 0.15%), Immigrants from Singapore (72.4%, a difference of 0.17%), and Immigrants from West Indies (72.4%, a difference of 0.20%).
| Demographics | Rating | Rank | In Labor Force | Age 20-24 |
| Armenians | 0.0 /100 | #300 | Tragic 72.5% |
| Cubans | 0.0 /100 | #301 | Tragic 72.5% |
| Natives/Alaskans | 0.0 /100 | #302 | Tragic 72.4% |
| Ecuadorians | 0.0 /100 | #303 | Tragic 72.4% |
| Immigrants | West Indies | 0.0 /100 | #304 | Tragic 72.4% |
| Immigrants | Singapore | 0.0 /100 | #305 | Tragic 72.4% |
| Immigrants | Jamaica | 0.0 /100 | #306 | Tragic 72.4% |
| Immigrants | Ecuador | 0.0 /100 | #307 | Tragic 72.3% |
| Soviet Union | 0.0 /100 | #308 | Tragic 72.3% |
| Tsimshian | 0.0 /100 | #309 | Tragic 72.3% |
| Immigrants | Cuba | 0.0 /100 | #310 | Tragic 72.0% |
| Apache | 0.0 /100 | #311 | Tragic 72.0% |
| Immigrants | Caribbean | 0.0 /100 | #312 | Tragic 71.9% |
| Immigrants | Dominica | 0.0 /100 | #313 | Tragic 71.9% |
| Indians (Asian) | 0.0 /100 | #314 | Tragic 71.9% |