Taiwanese vs Immigrants from Ecuador In Labor Force | Age 20-24
COMPARE
Taiwanese
Immigrants from Ecuador
In Labor Force | Age 20-24
In Labor Force | Age 20-24 Comparison
Taiwanese
Immigrants from Ecuador
74.7%
IN LABOR FORCE | AGE 20-24
23.2/ 100
METRIC RATING
199th/ 347
METRIC RANK
72.3%
IN LABOR FORCE | AGE 20-24
0.0/ 100
METRIC RATING
307th/ 347
METRIC RANK
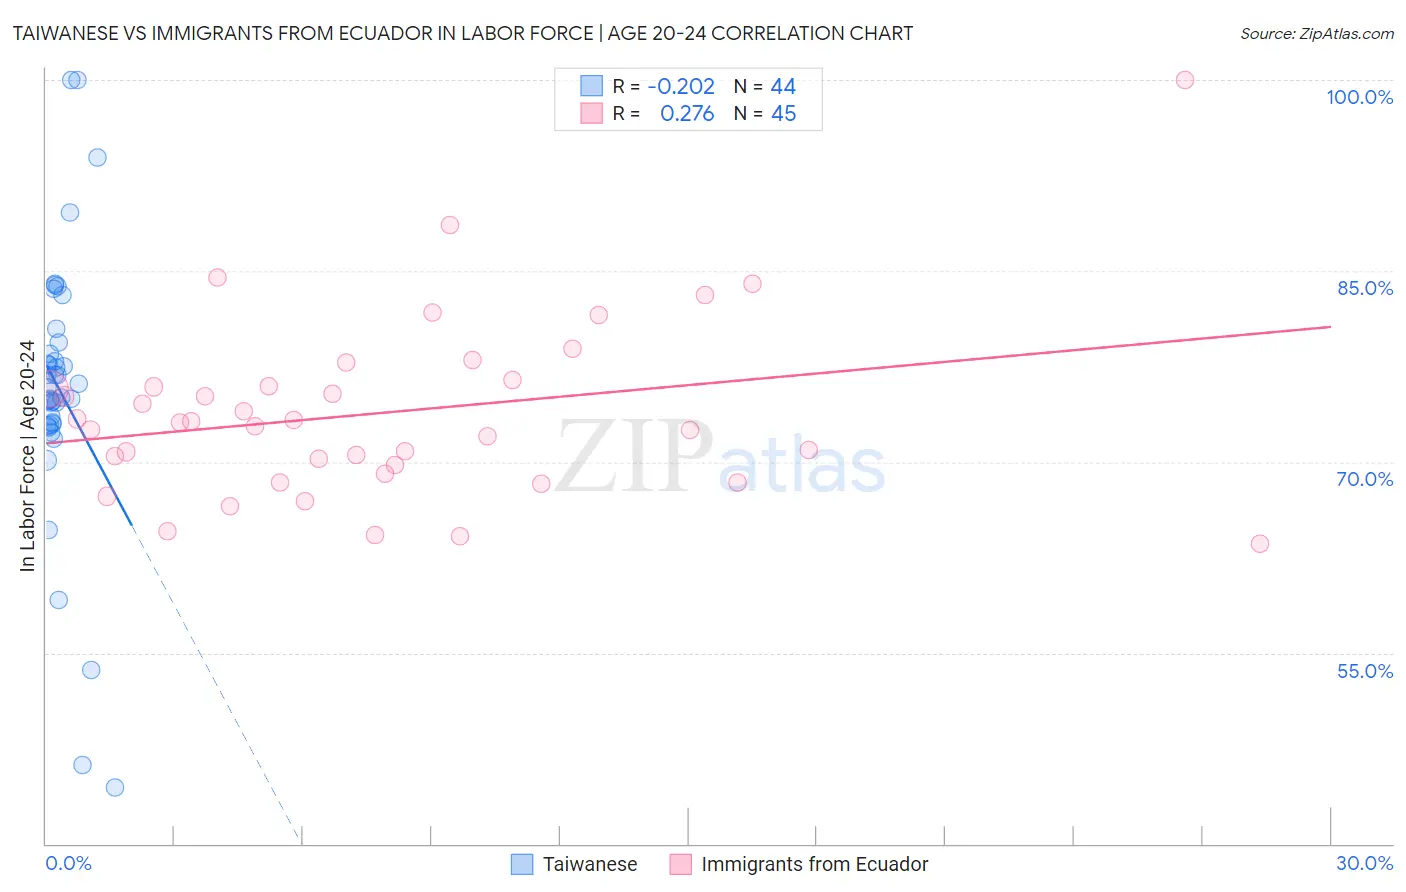
Taiwanese vs Immigrants from Ecuador In Labor Force | Age 20-24 Correlation Chart
The statistical analysis conducted on geographies consisting of 31,724,936 people shows a weak negative correlation between the proportion of Taiwanese and labor force participation rate among population between the ages 20 and 24 in the United States with a correlation coefficient (R) of -0.202 and weighted average of 74.7%. Similarly, the statistical analysis conducted on geographies consisting of 270,992,575 people shows a weak positive correlation between the proportion of Immigrants from Ecuador and labor force participation rate among population between the ages 20 and 24 in the United States with a correlation coefficient (R) of 0.276 and weighted average of 72.3%, a difference of 3.4%.
In Labor Force | Age 20-24 Correlation Summary
| Measurement | Taiwanese | Immigrants from Ecuador |
| Minimum | 44.4% | 63.6% |
| Maximum | 100.0% | 100.0% |
| Range | 55.6% | 36.4% |
| Mean | 75.7% | 73.9% |
| Median | 75.4% | 73.1% |
| Interquartile 25% (IQ1) | 73.0% | 69.4% |
| Interquartile 75% (IQ3) | 78.9% | 76.2% |
| Interquartile Range (IQR) | 6.0% | 6.7% |
| Standard Deviation (Sample) | 10.7% | 7.0% |
| Standard Deviation (Population) | 10.6% | 6.9% |
Similar Demographics by In Labor Force | Age 20-24
Demographics Similar to Taiwanese by In Labor Force | Age 20-24
In terms of in labor force | age 20-24, the demographic groups most similar to Taiwanese are Immigrants from Nigeria (74.7%, a difference of 0.020%), Nigerian (74.7%, a difference of 0.030%), Eastern European (74.8%, a difference of 0.040%), Immigrants from Vietnam (74.7%, a difference of 0.040%), and Panamanian (74.7%, a difference of 0.040%).
| Demographics | Rating | Rank | In Labor Force | Age 20-24 |
| Immigrants | Europe | 27.5 /100 | #192 | Fair 74.8% |
| Alsatians | 27.1 /100 | #193 | Fair 74.8% |
| Immigrants | Denmark | 25.8 /100 | #194 | Fair 74.8% |
| Eastern Europeans | 25.4 /100 | #195 | Fair 74.8% |
| Immigrants | Vietnam | 25.1 /100 | #196 | Fair 74.7% |
| Panamanians | 25.0 /100 | #197 | Fair 74.7% |
| Immigrants | Nigeria | 24.2 /100 | #198 | Fair 74.7% |
| Taiwanese | 23.2 /100 | #199 | Fair 74.7% |
| Nigerians | 21.9 /100 | #200 | Fair 74.7% |
| Choctaw | 21.4 /100 | #201 | Fair 74.7% |
| Moroccans | 20.4 /100 | #202 | Fair 74.7% |
| Immigrants | Northern Africa | 17.9 /100 | #203 | Poor 74.6% |
| Immigrants | Italy | 17.6 /100 | #204 | Poor 74.6% |
| Inupiat | 17.6 /100 | #205 | Poor 74.6% |
| Sioux | 17.5 /100 | #206 | Poor 74.6% |
Demographics Similar to Immigrants from Ecuador by In Labor Force | Age 20-24
In terms of in labor force | age 20-24, the demographic groups most similar to Immigrants from Ecuador are Soviet Union (72.3%, a difference of 0.010%), Tsimshian (72.3%, a difference of 0.010%), Immigrants from Jamaica (72.4%, a difference of 0.15%), Immigrants from Singapore (72.4%, a difference of 0.17%), and Immigrants from West Indies (72.4%, a difference of 0.20%).
| Demographics | Rating | Rank | In Labor Force | Age 20-24 |
| Armenians | 0.0 /100 | #300 | Tragic 72.5% |
| Cubans | 0.0 /100 | #301 | Tragic 72.5% |
| Natives/Alaskans | 0.0 /100 | #302 | Tragic 72.4% |
| Ecuadorians | 0.0 /100 | #303 | Tragic 72.4% |
| Immigrants | West Indies | 0.0 /100 | #304 | Tragic 72.4% |
| Immigrants | Singapore | 0.0 /100 | #305 | Tragic 72.4% |
| Immigrants | Jamaica | 0.0 /100 | #306 | Tragic 72.4% |
| Immigrants | Ecuador | 0.0 /100 | #307 | Tragic 72.3% |
| Soviet Union | 0.0 /100 | #308 | Tragic 72.3% |
| Tsimshian | 0.0 /100 | #309 | Tragic 72.3% |
| Immigrants | Cuba | 0.0 /100 | #310 | Tragic 72.0% |
| Apache | 0.0 /100 | #311 | Tragic 72.0% |
| Immigrants | Caribbean | 0.0 /100 | #312 | Tragic 71.9% |
| Immigrants | Dominica | 0.0 /100 | #313 | Tragic 71.9% |
| Indians (Asian) | 0.0 /100 | #314 | Tragic 71.9% |