Costa Rican vs Immigrants from Ecuador In Labor Force | Age 20-24
COMPARE
Costa Rican
Immigrants from Ecuador
In Labor Force | Age 20-24
In Labor Force | Age 20-24 Comparison
Costa Ricans
Immigrants from Ecuador
75.2%
IN LABOR FORCE | AGE 20-24
64.2/ 100
METRIC RATING
163rd/ 347
METRIC RANK
72.3%
IN LABOR FORCE | AGE 20-24
0.0/ 100
METRIC RATING
307th/ 347
METRIC RANK
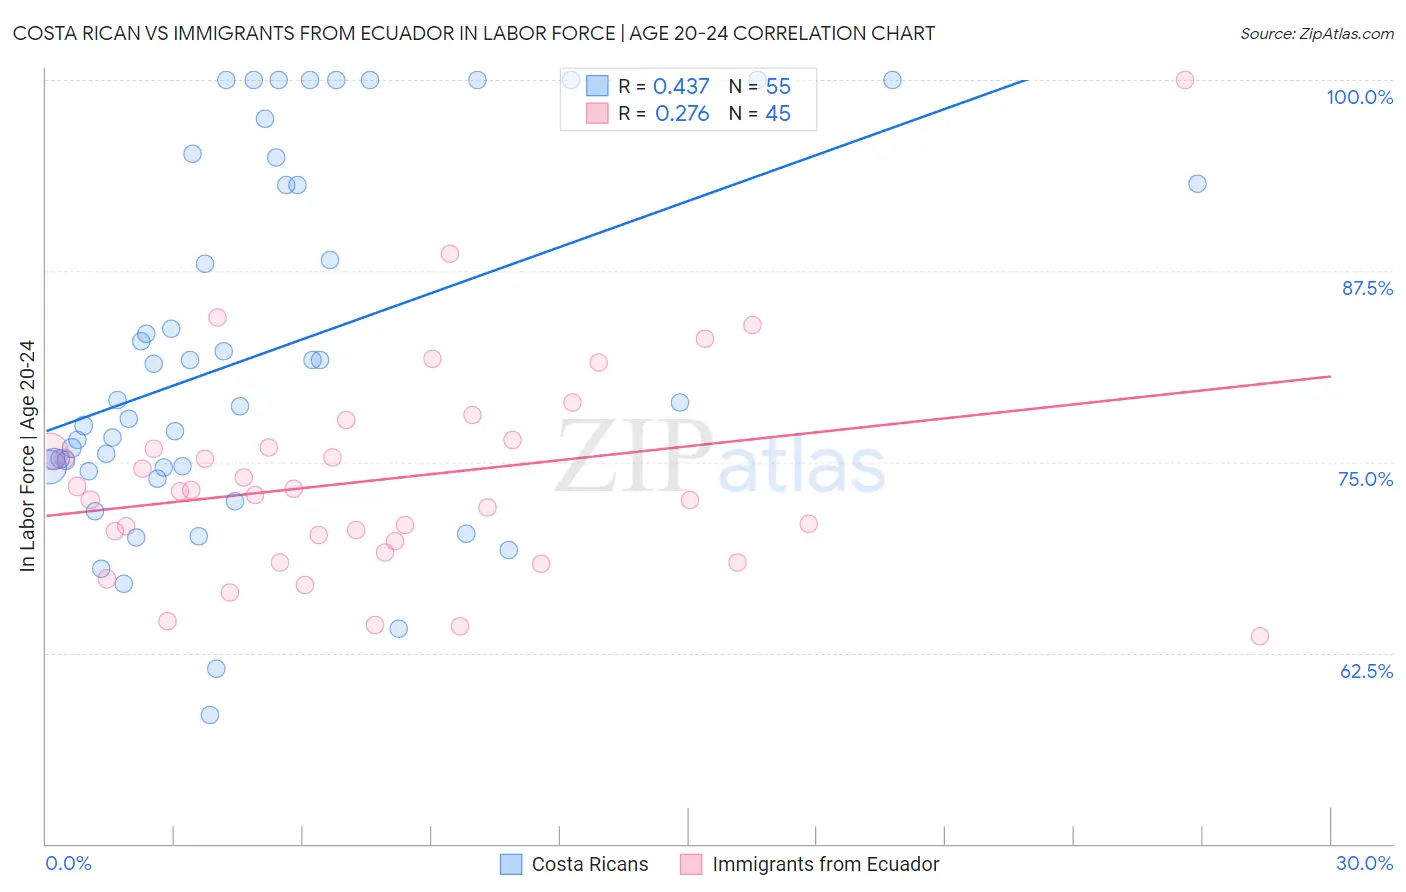
Costa Rican vs Immigrants from Ecuador In Labor Force | Age 20-24 Correlation Chart
The statistical analysis conducted on geographies consisting of 253,576,845 people shows a moderate positive correlation between the proportion of Costa Ricans and labor force participation rate among population between the ages 20 and 24 in the United States with a correlation coefficient (R) of 0.437 and weighted average of 75.2%. Similarly, the statistical analysis conducted on geographies consisting of 270,992,575 people shows a weak positive correlation between the proportion of Immigrants from Ecuador and labor force participation rate among population between the ages 20 and 24 in the United States with a correlation coefficient (R) of 0.276 and weighted average of 72.3%, a difference of 4.1%.
In Labor Force | Age 20-24 Correlation Summary
| Measurement | Costa Rican | Immigrants from Ecuador |
| Minimum | 58.4% | 63.6% |
| Maximum | 100.0% | 100.0% |
| Range | 41.6% | 36.4% |
| Mean | 82.1% | 73.9% |
| Median | 78.9% | 73.1% |
| Interquartile 25% (IQ1) | 74.6% | 69.4% |
| Interquartile 75% (IQ3) | 93.2% | 76.2% |
| Interquartile Range (IQR) | 18.6% | 6.7% |
| Standard Deviation (Sample) | 11.7% | 7.0% |
| Standard Deviation (Population) | 11.6% | 6.9% |
Similar Demographics by In Labor Force | Age 20-24
Demographics Similar to Costa Ricans by In Labor Force | Age 20-24
In terms of in labor force | age 20-24, the demographic groups most similar to Costa Ricans are Bolivian (75.2%, a difference of 0.0%), Immigrants from Romania (75.2%, a difference of 0.010%), Afghan (75.2%, a difference of 0.010%), New Zealander (75.2%, a difference of 0.020%), and Cambodian (75.2%, a difference of 0.060%).
| Demographics | Rating | Rank | In Labor Force | Age 20-24 |
| Immigrants | El Salvador | 71.7 /100 | #156 | Good 75.3% |
| Immigrants | Western Europe | 71.5 /100 | #157 | Good 75.3% |
| Immigrants | Bolivia | 71.0 /100 | #158 | Good 75.3% |
| South American Indians | 69.0 /100 | #159 | Good 75.3% |
| Japanese | 68.7 /100 | #160 | Good 75.3% |
| New Zealanders | 65.4 /100 | #161 | Good 75.2% |
| Immigrants | Romania | 64.6 /100 | #162 | Good 75.2% |
| Costa Ricans | 64.2 /100 | #163 | Good 75.2% |
| Bolivians | 64.0 /100 | #164 | Good 75.2% |
| Afghans | 63.5 /100 | #165 | Good 75.2% |
| Cambodians | 60.5 /100 | #166 | Good 75.2% |
| Immigrants | South Eastern Asia | 57.5 /100 | #167 | Average 75.1% |
| Immigrants | Western Africa | 56.7 /100 | #168 | Average 75.1% |
| Immigrants | Philippines | 55.8 /100 | #169 | Average 75.1% |
| Mexicans | 52.1 /100 | #170 | Average 75.1% |
Demographics Similar to Immigrants from Ecuador by In Labor Force | Age 20-24
In terms of in labor force | age 20-24, the demographic groups most similar to Immigrants from Ecuador are Soviet Union (72.3%, a difference of 0.010%), Tsimshian (72.3%, a difference of 0.010%), Immigrants from Jamaica (72.4%, a difference of 0.15%), Immigrants from Singapore (72.4%, a difference of 0.17%), and Immigrants from West Indies (72.4%, a difference of 0.20%).
| Demographics | Rating | Rank | In Labor Force | Age 20-24 |
| Armenians | 0.0 /100 | #300 | Tragic 72.5% |
| Cubans | 0.0 /100 | #301 | Tragic 72.5% |
| Natives/Alaskans | 0.0 /100 | #302 | Tragic 72.4% |
| Ecuadorians | 0.0 /100 | #303 | Tragic 72.4% |
| Immigrants | West Indies | 0.0 /100 | #304 | Tragic 72.4% |
| Immigrants | Singapore | 0.0 /100 | #305 | Tragic 72.4% |
| Immigrants | Jamaica | 0.0 /100 | #306 | Tragic 72.4% |
| Immigrants | Ecuador | 0.0 /100 | #307 | Tragic 72.3% |
| Soviet Union | 0.0 /100 | #308 | Tragic 72.3% |
| Tsimshian | 0.0 /100 | #309 | Tragic 72.3% |
| Immigrants | Cuba | 0.0 /100 | #310 | Tragic 72.0% |
| Apache | 0.0 /100 | #311 | Tragic 72.0% |
| Immigrants | Caribbean | 0.0 /100 | #312 | Tragic 71.9% |
| Immigrants | Dominica | 0.0 /100 | #313 | Tragic 71.9% |
| Indians (Asian) | 0.0 /100 | #314 | Tragic 71.9% |