Immigrants from Moldova vs Haitian In Labor Force | Age 35-44
COMPARE
Immigrants from Moldova
Haitian
In Labor Force | Age 35-44
In Labor Force | Age 35-44 Comparison
Immigrants from Moldova
Haitians
85.0%
IN LABOR FORCE | AGE 35-44
99.3/ 100
METRIC RATING
62nd/ 347
METRIC RANK
84.8%
IN LABOR FORCE | AGE 35-44
96.0/ 100
METRIC RATING
99th/ 347
METRIC RANK
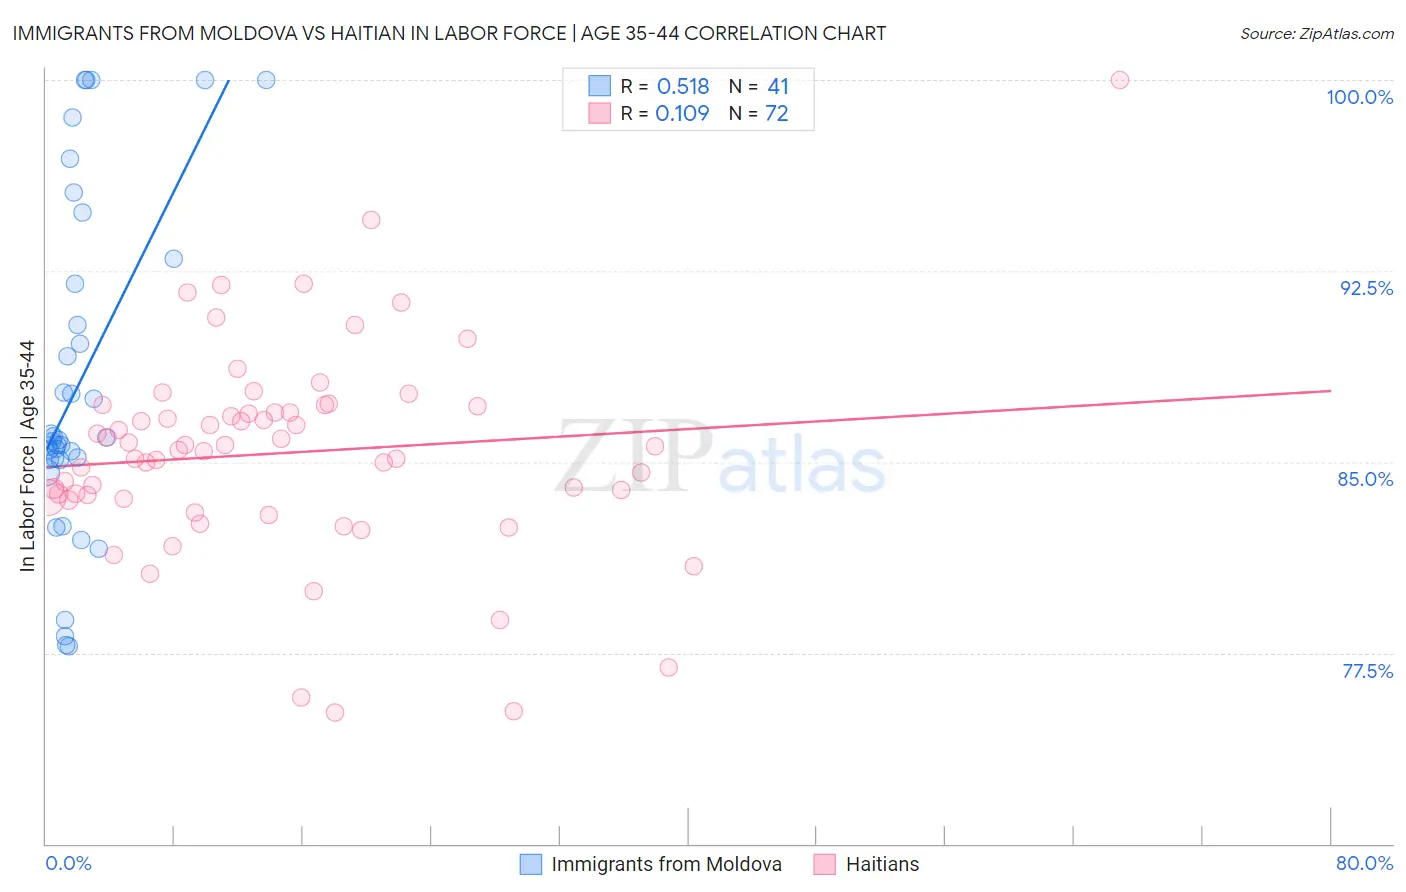
Immigrants from Moldova vs Haitian In Labor Force | Age 35-44 Correlation Chart
The statistical analysis conducted on geographies consisting of 124,382,028 people shows a substantial positive correlation between the proportion of Immigrants from Moldova and labor force participation rate among population between the ages 35 and 44 in the United States with a correlation coefficient (R) of 0.518 and weighted average of 85.0%. Similarly, the statistical analysis conducted on geographies consisting of 287,765,256 people shows a poor positive correlation between the proportion of Haitians and labor force participation rate among population between the ages 35 and 44 in the United States with a correlation coefficient (R) of 0.109 and weighted average of 84.8%, a difference of 0.28%.
In Labor Force | Age 35-44 Correlation Summary
| Measurement | Immigrants from Moldova | Haitian |
| Minimum | 77.8% | 75.2% |
| Maximum | 100.0% | 100.0% |
| Range | 22.2% | 24.8% |
| Mean | 88.1% | 85.3% |
| Median | 85.8% | 85.5% |
| Interquartile 25% (IQ1) | 85.1% | 83.6% |
| Interquartile 75% (IQ3) | 92.5% | 87.1% |
| Interquartile Range (IQR) | 7.4% | 3.5% |
| Standard Deviation (Sample) | 6.5% | 4.1% |
| Standard Deviation (Population) | 6.4% | 4.1% |
Similar Demographics by In Labor Force | Age 35-44
Demographics Similar to Immigrants from Moldova by In Labor Force | Age 35-44
In terms of in labor force | age 35-44, the demographic groups most similar to Immigrants from Moldova are Immigrants from Uganda (85.0%, a difference of 0.0%), Immigrants from Latvia (85.0%, a difference of 0.010%), Swedish (85.0%, a difference of 0.010%), Albanian (85.1%, a difference of 0.020%), and Immigrants from Brazil (85.0%, a difference of 0.020%).
| Demographics | Rating | Rank | In Labor Force | Age 35-44 |
| Soviet Union | 99.5 /100 | #55 | Exceptional 85.1% |
| Immigrants | Croatia | 99.5 /100 | #56 | Exceptional 85.1% |
| Chinese | 99.4 /100 | #57 | Exceptional 85.1% |
| Slovaks | 99.4 /100 | #58 | Exceptional 85.1% |
| Serbians | 99.4 /100 | #59 | Exceptional 85.1% |
| Albanians | 99.4 /100 | #60 | Exceptional 85.1% |
| Immigrants | Latvia | 99.3 /100 | #61 | Exceptional 85.0% |
| Immigrants | Moldova | 99.3 /100 | #62 | Exceptional 85.0% |
| Immigrants | Uganda | 99.3 /100 | #63 | Exceptional 85.0% |
| Swedes | 99.2 /100 | #64 | Exceptional 85.0% |
| Immigrants | Brazil | 99.2 /100 | #65 | Exceptional 85.0% |
| Immigrants | Haiti | 99.1 /100 | #66 | Exceptional 85.0% |
| Immigrants | Italy | 99.1 /100 | #67 | Exceptional 85.0% |
| Italians | 99.1 /100 | #68 | Exceptional 85.0% |
| Sudanese | 99.0 /100 | #69 | Exceptional 85.0% |
Demographics Similar to Haitians by In Labor Force | Age 35-44
In terms of in labor force | age 35-44, the demographic groups most similar to Haitians are Indian (Asian) (84.8%, a difference of 0.0%), Immigrants from Czechoslovakia (84.8%, a difference of 0.0%), Immigrants from Australia (84.8%, a difference of 0.020%), Immigrants from Southern Europe (84.8%, a difference of 0.020%), and Immigrants from Kuwait (84.8%, a difference of 0.030%).
| Demographics | Rating | Rank | In Labor Force | Age 35-44 |
| Ghanaians | 97.2 /100 | #92 | Exceptional 84.8% |
| Immigrants | Northern Africa | 97.1 /100 | #93 | Exceptional 84.8% |
| Mongolians | 96.8 /100 | #94 | Exceptional 84.8% |
| Immigrants | Kuwait | 96.7 /100 | #95 | Exceptional 84.8% |
| Cubans | 96.6 /100 | #96 | Exceptional 84.8% |
| Egyptians | 96.6 /100 | #97 | Exceptional 84.8% |
| Indians (Asian) | 96.1 /100 | #98 | Exceptional 84.8% |
| Haitians | 96.0 /100 | #99 | Exceptional 84.8% |
| Immigrants | Czechoslovakia | 95.9 /100 | #100 | Exceptional 84.8% |
| Immigrants | Australia | 95.5 /100 | #101 | Exceptional 84.8% |
| Immigrants | Southern Europe | 95.3 /100 | #102 | Exceptional 84.8% |
| Immigrants | Belarus | 95.3 /100 | #103 | Exceptional 84.8% |
| Immigrants | Sweden | 95.2 /100 | #104 | Exceptional 84.8% |
| South Americans | 95.0 /100 | #105 | Exceptional 84.8% |
| Immigrants | Bahamas | 94.8 /100 | #106 | Exceptional 84.8% |