Immigrants from Moldova vs Immigrants from Barbados Unemployment Among Women with Children Under 6 years
COMPARE
Immigrants from Moldova
Immigrants from Barbados
Unemployment Among Women with Children Under 6 years
Unemployment Among Women with Children Under 6 years Comparison
Immigrants from Moldova
Immigrants from Barbados
6.6%
UNEMPLOYMENT AMONG WOMEN WITH CHILDREN UNDER 6 YEARS
100.0/ 100
METRIC RATING
31st/ 347
METRIC RANK
8.0%
UNEMPLOYMENT AMONG WOMEN WITH CHILDREN UNDER 6 YEARS
4.2/ 100
METRIC RATING
236th/ 347
METRIC RANK
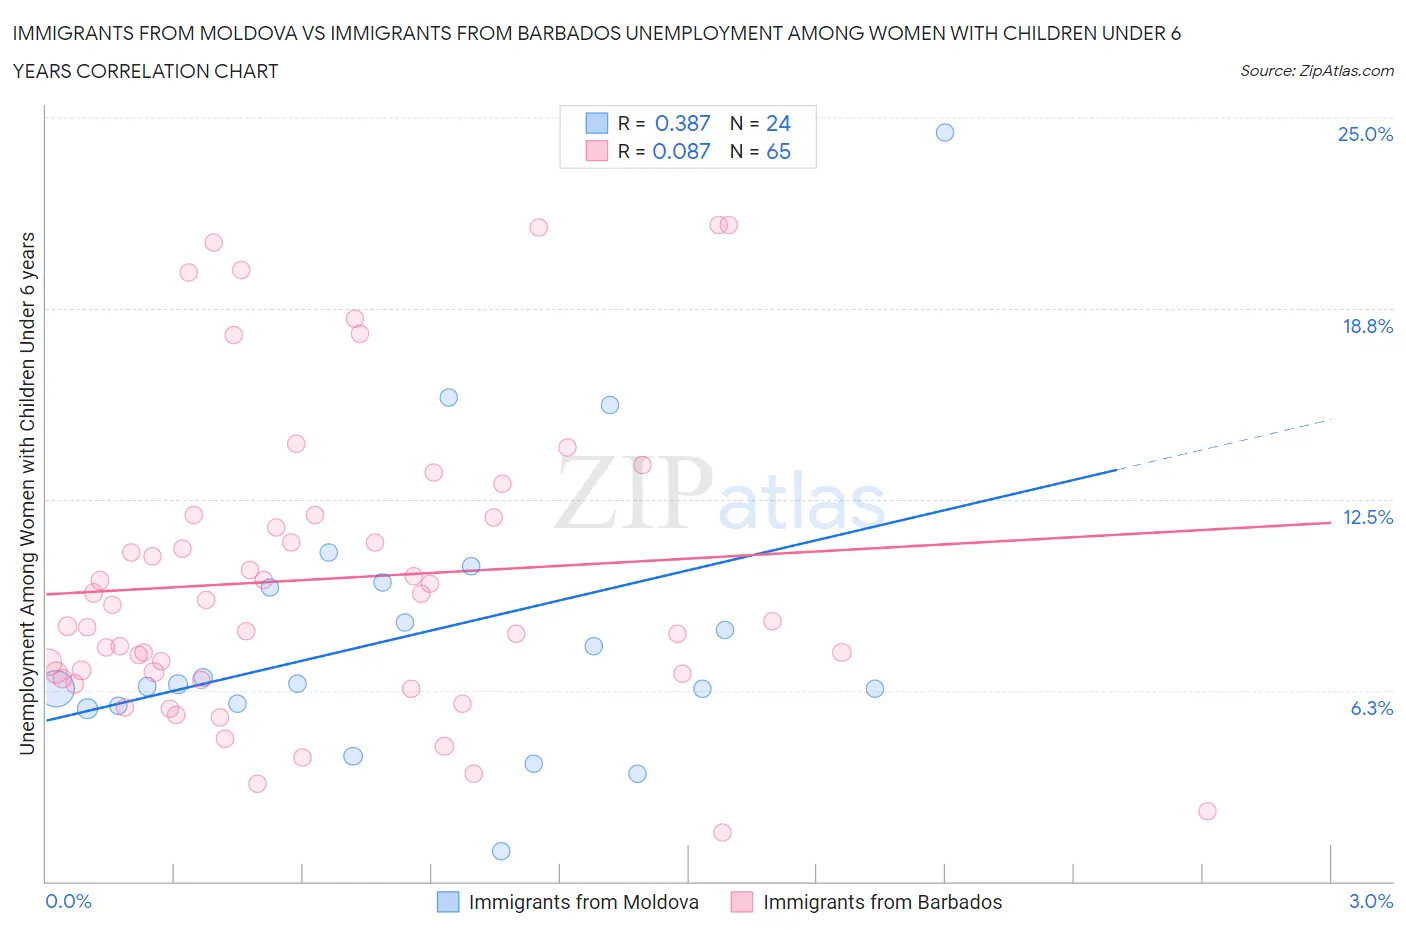
Immigrants from Moldova vs Immigrants from Barbados Unemployment Among Women with Children Under 6 years Correlation Chart
The statistical analysis conducted on geographies consisting of 108,789,886 people shows a mild positive correlation between the proportion of Immigrants from Moldova and unemployment rate among women with children under the age of 6 in the United States with a correlation coefficient (R) of 0.387 and weighted average of 6.6%. Similarly, the statistical analysis conducted on geographies consisting of 101,537,844 people shows a slight positive correlation between the proportion of Immigrants from Barbados and unemployment rate among women with children under the age of 6 in the United States with a correlation coefficient (R) of 0.087 and weighted average of 8.0%, a difference of 21.8%.
Unemployment Among Women with Children Under 6 years Correlation Summary
| Measurement | Immigrants from Moldova | Immigrants from Barbados |
| Minimum | 1.0% | 1.6% |
| Maximum | 24.5% | 21.5% |
| Range | 23.5% | 19.9% |
| Mean | 8.1% | 9.9% |
| Median | 6.5% | 8.5% |
| Interquartile 25% (IQ1) | 5.8% | 6.7% |
| Interquartile 75% (IQ3) | 9.7% | 11.9% |
| Interquartile Range (IQR) | 3.9% | 5.2% |
| Standard Deviation (Sample) | 4.9% | 4.9% |
| Standard Deviation (Population) | 4.8% | 4.9% |
Similar Demographics by Unemployment Among Women with Children Under 6 years
Demographics Similar to Immigrants from Moldova by Unemployment Among Women with Children Under 6 years
In terms of unemployment among women with children under 6 years, the demographic groups most similar to Immigrants from Moldova are Tsimshian (6.6%, a difference of 0.070%), Immigrants from Vietnam (6.6%, a difference of 0.080%), Immigrants from South Central Asia (6.6%, a difference of 0.090%), Immigrants from Belarus (6.6%, a difference of 0.29%), and Yakama (6.6%, a difference of 0.36%).
| Demographics | Rating | Rank | Unemployment Among Women with Children Under 6 years |
| Laotians | 100.0 /100 | #24 | Exceptional 6.5% |
| Soviet Union | 100.0 /100 | #25 | Exceptional 6.5% |
| Cypriots | 100.0 /100 | #26 | Exceptional 6.5% |
| Immigrants | Japan | 100.0 /100 | #27 | Exceptional 6.5% |
| Immigrants | Israel | 100.0 /100 | #28 | Exceptional 6.5% |
| Immigrants | Sweden | 100.0 /100 | #29 | Exceptional 6.6% |
| Immigrants | Belarus | 100.0 /100 | #30 | Exceptional 6.6% |
| Immigrants | Moldova | 100.0 /100 | #31 | Exceptional 6.6% |
| Tsimshian | 100.0 /100 | #32 | Exceptional 6.6% |
| Immigrants | Vietnam | 100.0 /100 | #33 | Exceptional 6.6% |
| Immigrants | South Central Asia | 100.0 /100 | #34 | Exceptional 6.6% |
| Yakama | 100.0 /100 | #35 | Exceptional 6.6% |
| Luxembourgers | 100.0 /100 | #36 | Exceptional 6.6% |
| Sri Lankans | 100.0 /100 | #37 | Exceptional 6.6% |
| Hmong | 100.0 /100 | #38 | Exceptional 6.7% |
Demographics Similar to Immigrants from Barbados by Unemployment Among Women with Children Under 6 years
In terms of unemployment among women with children under 6 years, the demographic groups most similar to Immigrants from Barbados are Comanche (8.0%, a difference of 0.020%), Kiowa (8.0%, a difference of 0.050%), Immigrants from Costa Rica (8.0%, a difference of 0.060%), Immigrants from Trinidad and Tobago (8.0%, a difference of 0.20%), and Welsh (8.0%, a difference of 0.29%).
| Demographics | Rating | Rank | Unemployment Among Women with Children Under 6 years |
| Salvadorans | 5.5 /100 | #229 | Tragic 8.0% |
| Finns | 5.3 /100 | #230 | Tragic 8.0% |
| Trinidadians and Tobagonians | 5.3 /100 | #231 | Tragic 8.0% |
| Welsh | 5.0 /100 | #232 | Tragic 8.0% |
| Immigrants | Trinidad and Tobago | 4.8 /100 | #233 | Tragic 8.0% |
| Kiowa | 4.4 /100 | #234 | Tragic 8.0% |
| Comanche | 4.3 /100 | #235 | Tragic 8.0% |
| Immigrants | Barbados | 4.2 /100 | #236 | Tragic 8.0% |
| Immigrants | Costa Rica | 4.1 /100 | #237 | Tragic 8.0% |
| Immigrants | Middle Africa | 3.2 /100 | #238 | Tragic 8.1% |
| Irish | 2.7 /100 | #239 | Tragic 8.1% |
| Immigrants | El Salvador | 2.6 /100 | #240 | Tragic 8.1% |
| Liberians | 2.6 /100 | #241 | Tragic 8.1% |
| Dutch | 2.5 /100 | #242 | Tragic 8.1% |
| Hawaiians | 1.8 /100 | #243 | Tragic 8.2% |