Immigrants from Moldova vs Ottawa In Labor Force | Age 35-44
COMPARE
Immigrants from Moldova
Ottawa
In Labor Force | Age 35-44
In Labor Force | Age 35-44 Comparison
Immigrants from Moldova
Ottawa
85.0%
IN LABOR FORCE | AGE 35-44
99.3/ 100
METRIC RATING
62nd/ 347
METRIC RANK
82.6%
IN LABOR FORCE | AGE 35-44
0.0/ 100
METRIC RATING
298th/ 347
METRIC RANK
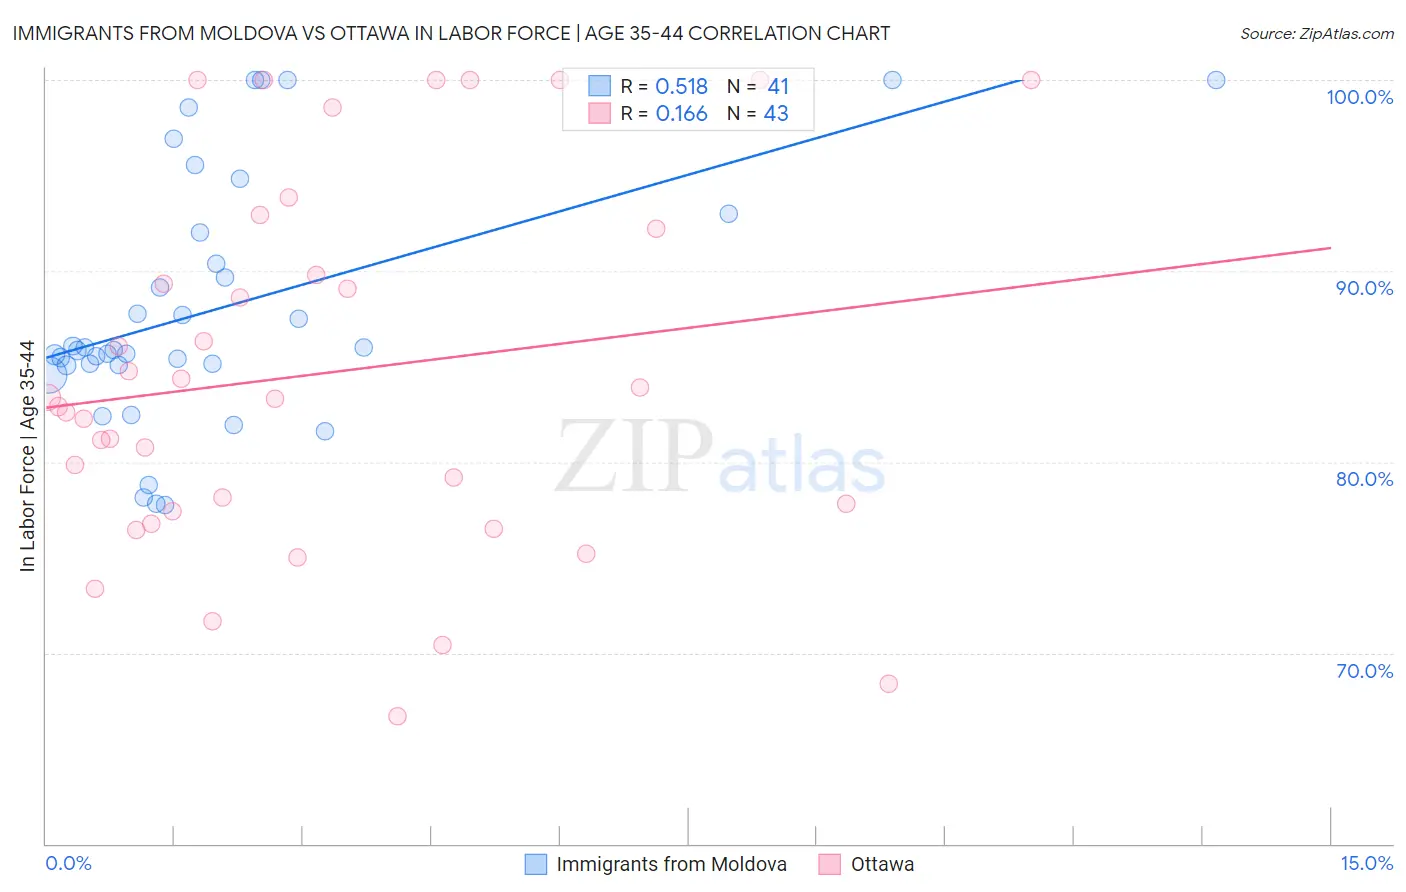
Immigrants from Moldova vs Ottawa In Labor Force | Age 35-44 Correlation Chart
The statistical analysis conducted on geographies consisting of 124,382,028 people shows a substantial positive correlation between the proportion of Immigrants from Moldova and labor force participation rate among population between the ages 35 and 44 in the United States with a correlation coefficient (R) of 0.518 and weighted average of 85.0%. Similarly, the statistical analysis conducted on geographies consisting of 49,950,273 people shows a poor positive correlation between the proportion of Ottawa and labor force participation rate among population between the ages 35 and 44 in the United States with a correlation coefficient (R) of 0.166 and weighted average of 82.6%, a difference of 3.0%.
In Labor Force | Age 35-44 Correlation Summary
| Measurement | Immigrants from Moldova | Ottawa |
| Minimum | 77.8% | 66.7% |
| Maximum | 100.0% | 100.0% |
| Range | 22.2% | 33.3% |
| Mean | 88.1% | 84.6% |
| Median | 85.8% | 83.3% |
| Interquartile 25% (IQ1) | 85.1% | 77.4% |
| Interquartile 75% (IQ3) | 92.5% | 92.2% |
| Interquartile Range (IQR) | 7.4% | 14.8% |
| Standard Deviation (Sample) | 6.5% | 9.6% |
| Standard Deviation (Population) | 6.4% | 9.5% |
Similar Demographics by In Labor Force | Age 35-44
Demographics Similar to Immigrants from Moldova by In Labor Force | Age 35-44
In terms of in labor force | age 35-44, the demographic groups most similar to Immigrants from Moldova are Immigrants from Uganda (85.0%, a difference of 0.0%), Immigrants from Latvia (85.0%, a difference of 0.010%), Swedish (85.0%, a difference of 0.010%), Albanian (85.1%, a difference of 0.020%), and Immigrants from Brazil (85.0%, a difference of 0.020%).
| Demographics | Rating | Rank | In Labor Force | Age 35-44 |
| Soviet Union | 99.5 /100 | #55 | Exceptional 85.1% |
| Immigrants | Croatia | 99.5 /100 | #56 | Exceptional 85.1% |
| Chinese | 99.4 /100 | #57 | Exceptional 85.1% |
| Slovaks | 99.4 /100 | #58 | Exceptional 85.1% |
| Serbians | 99.4 /100 | #59 | Exceptional 85.1% |
| Albanians | 99.4 /100 | #60 | Exceptional 85.1% |
| Immigrants | Latvia | 99.3 /100 | #61 | Exceptional 85.0% |
| Immigrants | Moldova | 99.3 /100 | #62 | Exceptional 85.0% |
| Immigrants | Uganda | 99.3 /100 | #63 | Exceptional 85.0% |
| Swedes | 99.2 /100 | #64 | Exceptional 85.0% |
| Immigrants | Brazil | 99.2 /100 | #65 | Exceptional 85.0% |
| Immigrants | Haiti | 99.1 /100 | #66 | Exceptional 85.0% |
| Immigrants | Italy | 99.1 /100 | #67 | Exceptional 85.0% |
| Italians | 99.1 /100 | #68 | Exceptional 85.0% |
| Sudanese | 99.0 /100 | #69 | Exceptional 85.0% |
Demographics Similar to Ottawa by In Labor Force | Age 35-44
In terms of in labor force | age 35-44, the demographic groups most similar to Ottawa are Tlingit-Haida (82.5%, a difference of 0.010%), Mexican American Indian (82.6%, a difference of 0.020%), Hmong (82.6%, a difference of 0.020%), Central American Indian (82.5%, a difference of 0.080%), and Spanish American Indian (82.5%, a difference of 0.10%).
| Demographics | Rating | Rank | In Labor Force | Age 35-44 |
| Pennsylvania Germans | 0.0 /100 | #291 | Tragic 82.9% |
| Immigrants | Latin America | 0.0 /100 | #292 | Tragic 82.8% |
| Spanish Americans | 0.0 /100 | #293 | Tragic 82.8% |
| Potawatomi | 0.0 /100 | #294 | Tragic 82.7% |
| Immigrants | Lebanon | 0.0 /100 | #295 | Tragic 82.7% |
| Mexican American Indians | 0.0 /100 | #296 | Tragic 82.6% |
| Hmong | 0.0 /100 | #297 | Tragic 82.6% |
| Ottawa | 0.0 /100 | #298 | Tragic 82.6% |
| Tlingit-Haida | 0.0 /100 | #299 | Tragic 82.5% |
| Central American Indians | 0.0 /100 | #300 | Tragic 82.5% |
| Spanish American Indians | 0.0 /100 | #301 | Tragic 82.5% |
| Americans | 0.0 /100 | #302 | Tragic 82.4% |
| Nepalese | 0.0 /100 | #303 | Tragic 82.4% |
| Marshallese | 0.0 /100 | #304 | Tragic 82.4% |
| Shoshone | 0.0 /100 | #305 | Tragic 82.2% |