Immigrants from Mexico vs Ute In Labor Force | Age 35-44
COMPARE
Immigrants from Mexico
Ute
In Labor Force | Age 35-44
In Labor Force | Age 35-44 Comparison
Immigrants from Mexico
Ute
81.5%
IN LABOR FORCE | AGE 35-44
0.0/ 100
METRIC RATING
315th/ 347
METRIC RANK
79.4%
IN LABOR FORCE | AGE 35-44
0.0/ 100
METRIC RATING
332nd/ 347
METRIC RANK
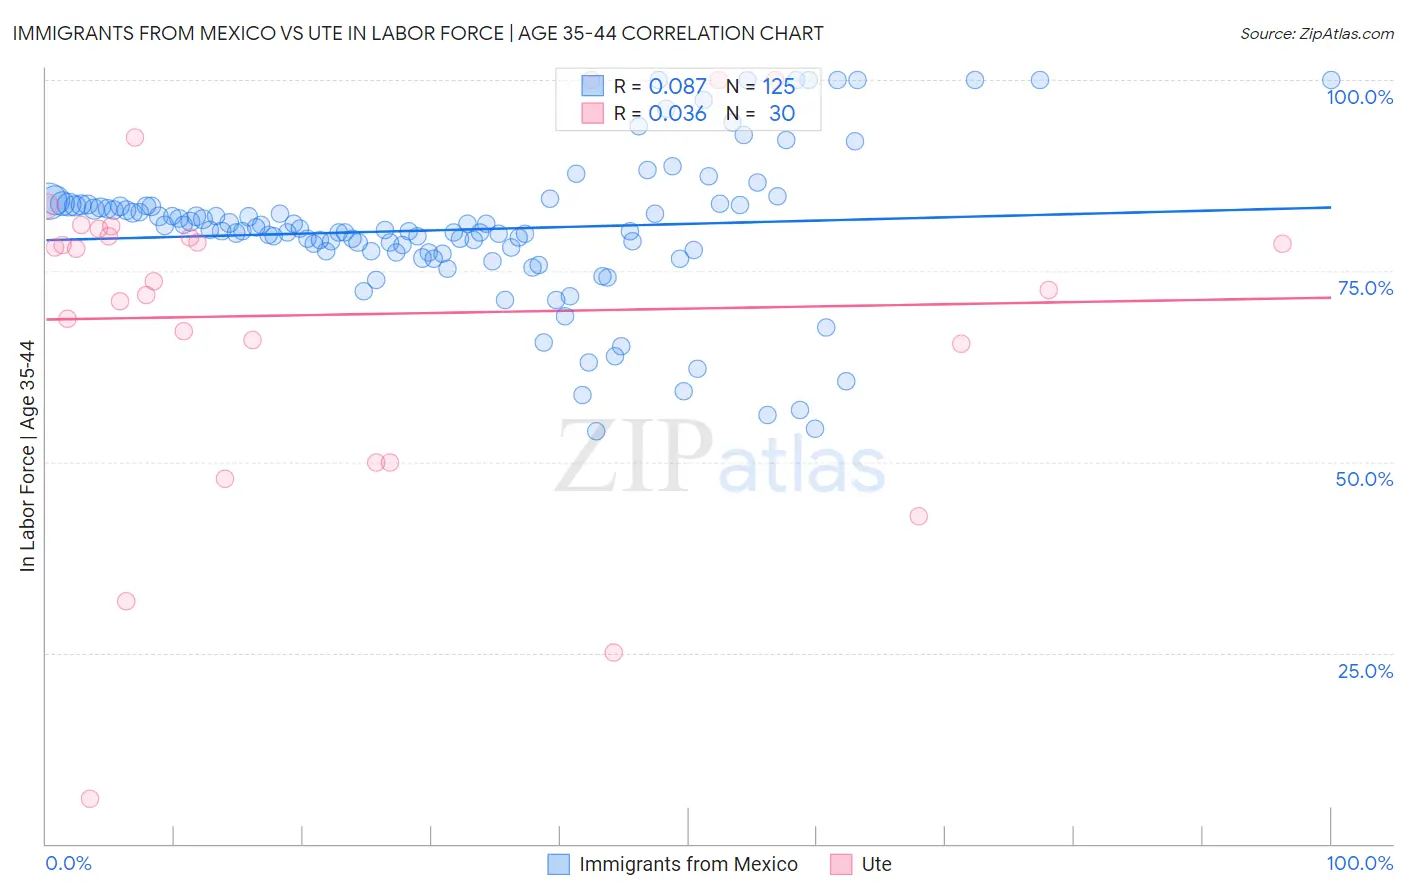
Immigrants from Mexico vs Ute In Labor Force | Age 35-44 Correlation Chart
The statistical analysis conducted on geographies consisting of 513,440,276 people shows a slight positive correlation between the proportion of Immigrants from Mexico and labor force participation rate among population between the ages 35 and 44 in the United States with a correlation coefficient (R) of 0.087 and weighted average of 81.5%. Similarly, the statistical analysis conducted on geographies consisting of 55,667,547 people shows no correlation between the proportion of Ute and labor force participation rate among population between the ages 35 and 44 in the United States with a correlation coefficient (R) of 0.036 and weighted average of 79.4%, a difference of 2.6%.
In Labor Force | Age 35-44 Correlation Summary
| Measurement | Immigrants from Mexico | Ute |
| Minimum | 54.0% | 5.9% |
| Maximum | 100.0% | 100.0% |
| Range | 46.0% | 94.1% |
| Mean | 80.4% | 69.3% |
| Median | 80.3% | 75.8% |
| Interquartile 25% (IQ1) | 77.5% | 65.5% |
| Interquartile 75% (IQ3) | 83.6% | 80.5% |
| Interquartile Range (IQR) | 6.1% | 15.0% |
| Standard Deviation (Sample) | 9.6% | 21.9% |
| Standard Deviation (Population) | 9.6% | 21.6% |
Demographics Similar to Immigrants from Mexico and Ute by In Labor Force | Age 35-44
In terms of in labor force | age 35-44, the demographic groups most similar to Immigrants from Mexico are Cajun (81.5%, a difference of 0.020%), Comanche (81.5%, a difference of 0.020%), Cherokee (81.4%, a difference of 0.10%), Mexican (81.6%, a difference of 0.14%), and Alaskan Athabascan (81.3%, a difference of 0.22%). Similarly, the demographic groups most similar to Ute are Houma (79.5%, a difference of 0.060%), Cheyenne (79.5%, a difference of 0.080%), Menominee (79.7%, a difference of 0.28%), Kiowa (79.2%, a difference of 0.33%), and Creek (80.0%, a difference of 0.71%).
| Demographics | Rating | Rank | In Labor Force | Age 35-44 |
| Mexicans | 0.0 /100 | #313 | Tragic 81.6% |
| Cajuns | 0.0 /100 | #314 | Tragic 81.5% |
| Immigrants | Mexico | 0.0 /100 | #315 | Tragic 81.5% |
| Comanche | 0.0 /100 | #316 | Tragic 81.5% |
| Cherokee | 0.0 /100 | #317 | Tragic 81.4% |
| Alaskan Athabascans | 0.0 /100 | #318 | Tragic 81.3% |
| Inupiat | 0.0 /100 | #319 | Tragic 80.9% |
| Chickasaw | 0.0 /100 | #320 | Tragic 80.9% |
| Puerto Ricans | 0.0 /100 | #321 | Tragic 80.7% |
| Paiute | 0.0 /100 | #322 | Tragic 80.6% |
| Yaqui | 0.0 /100 | #323 | Tragic 80.5% |
| Choctaw | 0.0 /100 | #324 | Tragic 80.5% |
| Dutch West Indians | 0.0 /100 | #325 | Tragic 80.4% |
| Seminole | 0.0 /100 | #326 | Tragic 80.4% |
| Sioux | 0.0 /100 | #327 | Tragic 80.2% |
| Creek | 0.0 /100 | #328 | Tragic 80.0% |
| Menominee | 0.0 /100 | #329 | Tragic 79.7% |
| Cheyenne | 0.0 /100 | #330 | Tragic 79.5% |
| Houma | 0.0 /100 | #331 | Tragic 79.5% |
| Ute | 0.0 /100 | #332 | Tragic 79.4% |
| Kiowa | 0.0 /100 | #333 | Tragic 79.2% |