Immigrants from Mexico vs Immigrants from Burma/Myanmar In Labor Force | Age 35-44
COMPARE
Immigrants from Mexico
Immigrants from Burma/Myanmar
In Labor Force | Age 35-44
In Labor Force | Age 35-44 Comparison
Immigrants from Mexico
Immigrants from Burma/Myanmar
81.5%
IN LABOR FORCE | AGE 35-44
0.0/ 100
METRIC RATING
315th/ 347
METRIC RANK
84.0%
IN LABOR FORCE | AGE 35-44
6.1/ 100
METRIC RATING
225th/ 347
METRIC RANK
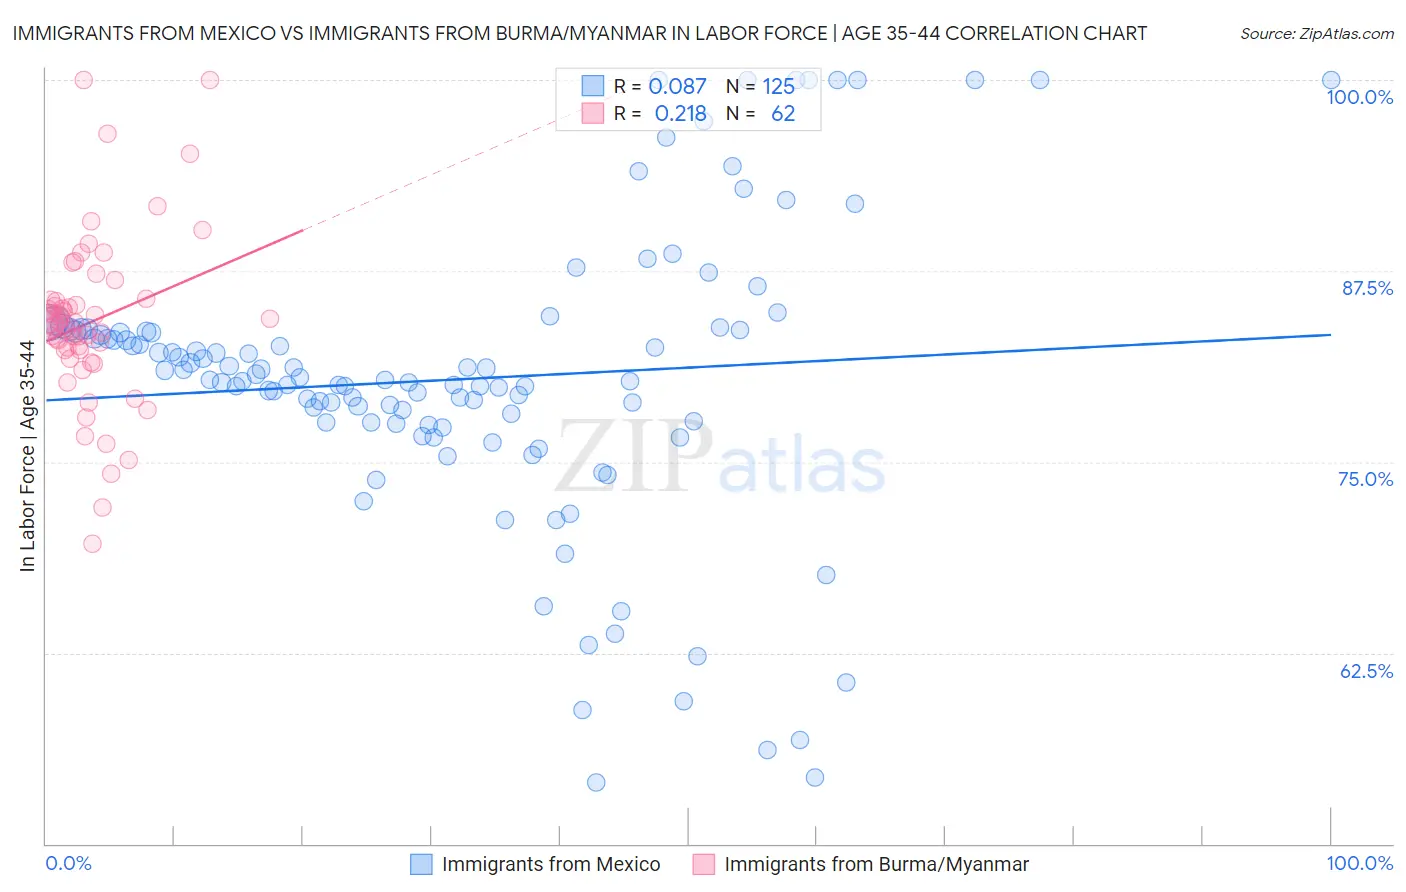
Immigrants from Mexico vs Immigrants from Burma/Myanmar In Labor Force | Age 35-44 Correlation Chart
The statistical analysis conducted on geographies consisting of 513,440,276 people shows a slight positive correlation between the proportion of Immigrants from Mexico and labor force participation rate among population between the ages 35 and 44 in the United States with a correlation coefficient (R) of 0.087 and weighted average of 81.5%. Similarly, the statistical analysis conducted on geographies consisting of 172,270,832 people shows a weak positive correlation between the proportion of Immigrants from Burma/Myanmar and labor force participation rate among population between the ages 35 and 44 in the United States with a correlation coefficient (R) of 0.218 and weighted average of 84.0%, a difference of 3.1%.
In Labor Force | Age 35-44 Correlation Summary
| Measurement | Immigrants from Mexico | Immigrants from Burma/Myanmar |
| Minimum | 54.0% | 69.6% |
| Maximum | 100.0% | 100.0% |
| Range | 46.0% | 30.4% |
| Mean | 80.4% | 84.2% |
| Median | 80.3% | 84.1% |
| Interquartile 25% (IQ1) | 77.5% | 82.3% |
| Interquartile 75% (IQ3) | 83.6% | 85.6% |
| Interquartile Range (IQR) | 6.1% | 3.3% |
| Standard Deviation (Sample) | 9.6% | 5.6% |
| Standard Deviation (Population) | 9.6% | 5.5% |
Similar Demographics by In Labor Force | Age 35-44
Demographics Similar to Immigrants from Mexico by In Labor Force | Age 35-44
In terms of in labor force | age 35-44, the demographic groups most similar to Immigrants from Mexico are Cajun (81.5%, a difference of 0.020%), Comanche (81.5%, a difference of 0.020%), Cherokee (81.4%, a difference of 0.10%), Alaska Native (81.6%, a difference of 0.14%), and Mexican (81.6%, a difference of 0.14%).
| Demographics | Rating | Rank | In Labor Force | Age 35-44 |
| Immigrants | Central America | 0.0 /100 | #308 | Tragic 82.0% |
| Cree | 0.0 /100 | #309 | Tragic 82.0% |
| Blackfeet | 0.0 /100 | #310 | Tragic 81.9% |
| Colville | 0.0 /100 | #311 | Tragic 81.7% |
| Alaska Natives | 0.0 /100 | #312 | Tragic 81.6% |
| Mexicans | 0.0 /100 | #313 | Tragic 81.6% |
| Cajuns | 0.0 /100 | #314 | Tragic 81.5% |
| Immigrants | Mexico | 0.0 /100 | #315 | Tragic 81.5% |
| Comanche | 0.0 /100 | #316 | Tragic 81.5% |
| Cherokee | 0.0 /100 | #317 | Tragic 81.4% |
| Alaskan Athabascans | 0.0 /100 | #318 | Tragic 81.3% |
| Inupiat | 0.0 /100 | #319 | Tragic 80.9% |
| Chickasaw | 0.0 /100 | #320 | Tragic 80.9% |
| Puerto Ricans | 0.0 /100 | #321 | Tragic 80.7% |
| Paiute | 0.0 /100 | #322 | Tragic 80.6% |
Demographics Similar to Immigrants from Burma/Myanmar by In Labor Force | Age 35-44
In terms of in labor force | age 35-44, the demographic groups most similar to Immigrants from Burma/Myanmar are U.S. Virgin Islander (84.0%, a difference of 0.0%), Assyrian/Chaldean/Syriac (84.0%, a difference of 0.010%), Immigrants from Panama (84.0%, a difference of 0.010%), Icelander (84.0%, a difference of 0.020%), and Panamanian (84.0%, a difference of 0.020%).
| Demographics | Rating | Rank | In Labor Force | Age 35-44 |
| Immigrants | Nicaragua | 9.4 /100 | #218 | Tragic 84.1% |
| Sub-Saharan Africans | 9.3 /100 | #219 | Tragic 84.1% |
| French | 7.5 /100 | #220 | Tragic 84.0% |
| Icelanders | 6.7 /100 | #221 | Tragic 84.0% |
| Assyrians/Chaldeans/Syriacs | 6.6 /100 | #222 | Tragic 84.0% |
| Immigrants | Panama | 6.4 /100 | #223 | Tragic 84.0% |
| U.S. Virgin Islanders | 6.1 /100 | #224 | Tragic 84.0% |
| Immigrants | Burma/Myanmar | 6.1 /100 | #225 | Tragic 84.0% |
| Panamanians | 5.4 /100 | #226 | Tragic 84.0% |
| British West Indians | 5.3 /100 | #227 | Tragic 84.0% |
| Welsh | 5.3 /100 | #228 | Tragic 84.0% |
| Immigrants | Thailand | 4.7 /100 | #229 | Tragic 84.0% |
| Immigrants | Iraq | 3.7 /100 | #230 | Tragic 83.9% |
| Scottish | 3.2 /100 | #231 | Tragic 83.9% |
| Native Hawaiians | 3.0 /100 | #232 | Tragic 83.9% |