Immigrants from Mexico vs Latvian In Labor Force | Age 35-44
COMPARE
Immigrants from Mexico
Latvian
In Labor Force | Age 35-44
In Labor Force | Age 35-44 Comparison
Immigrants from Mexico
Latvians
81.5%
IN LABOR FORCE | AGE 35-44
0.0/ 100
METRIC RATING
315th/ 347
METRIC RANK
85.4%
IN LABOR FORCE | AGE 35-44
99.9/ 100
METRIC RATING
24th/ 347
METRIC RANK
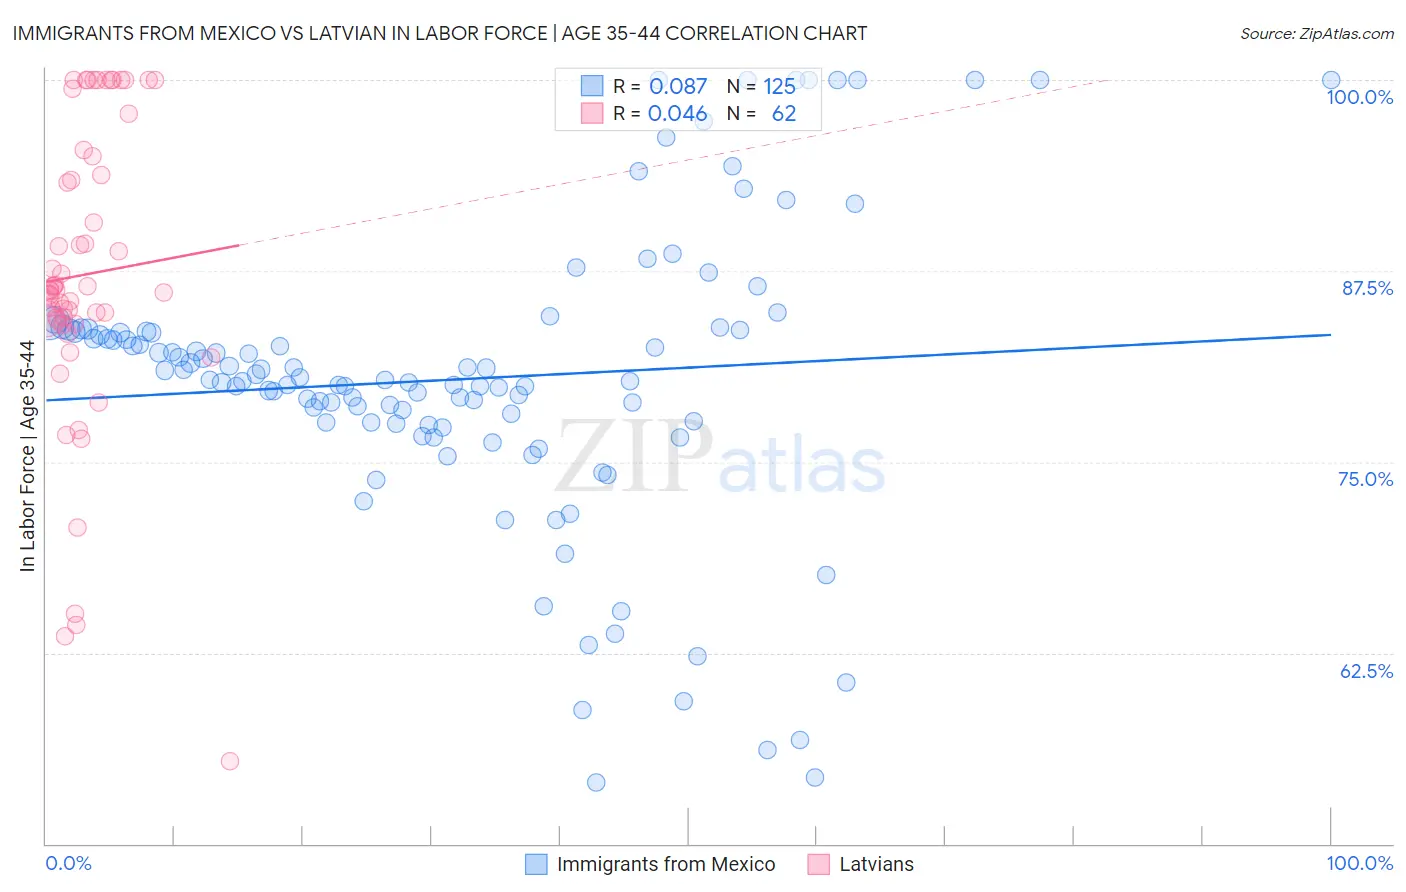
Immigrants from Mexico vs Latvian In Labor Force | Age 35-44 Correlation Chart
The statistical analysis conducted on geographies consisting of 513,440,276 people shows a slight positive correlation between the proportion of Immigrants from Mexico and labor force participation rate among population between the ages 35 and 44 in the United States with a correlation coefficient (R) of 0.087 and weighted average of 81.5%. Similarly, the statistical analysis conducted on geographies consisting of 220,671,100 people shows no correlation between the proportion of Latvians and labor force participation rate among population between the ages 35 and 44 in the United States with a correlation coefficient (R) of 0.046 and weighted average of 85.4%, a difference of 4.8%.
In Labor Force | Age 35-44 Correlation Summary
| Measurement | Immigrants from Mexico | Latvian |
| Minimum | 54.0% | 55.4% |
| Maximum | 100.0% | 100.0% |
| Range | 46.0% | 44.6% |
| Mean | 80.4% | 87.3% |
| Median | 80.3% | 86.3% |
| Interquartile 25% (IQ1) | 77.5% | 84.3% |
| Interquartile 75% (IQ3) | 83.6% | 95.0% |
| Interquartile Range (IQR) | 6.1% | 10.7% |
| Standard Deviation (Sample) | 9.6% | 9.9% |
| Standard Deviation (Population) | 9.6% | 9.8% |
Similar Demographics by In Labor Force | Age 35-44
Demographics Similar to Immigrants from Mexico by In Labor Force | Age 35-44
In terms of in labor force | age 35-44, the demographic groups most similar to Immigrants from Mexico are Cajun (81.5%, a difference of 0.020%), Comanche (81.5%, a difference of 0.020%), Cherokee (81.4%, a difference of 0.10%), Alaska Native (81.6%, a difference of 0.14%), and Mexican (81.6%, a difference of 0.14%).
| Demographics | Rating | Rank | In Labor Force | Age 35-44 |
| Immigrants | Central America | 0.0 /100 | #308 | Tragic 82.0% |
| Cree | 0.0 /100 | #309 | Tragic 82.0% |
| Blackfeet | 0.0 /100 | #310 | Tragic 81.9% |
| Colville | 0.0 /100 | #311 | Tragic 81.7% |
| Alaska Natives | 0.0 /100 | #312 | Tragic 81.6% |
| Mexicans | 0.0 /100 | #313 | Tragic 81.6% |
| Cajuns | 0.0 /100 | #314 | Tragic 81.5% |
| Immigrants | Mexico | 0.0 /100 | #315 | Tragic 81.5% |
| Comanche | 0.0 /100 | #316 | Tragic 81.5% |
| Cherokee | 0.0 /100 | #317 | Tragic 81.4% |
| Alaskan Athabascans | 0.0 /100 | #318 | Tragic 81.3% |
| Inupiat | 0.0 /100 | #319 | Tragic 80.9% |
| Chickasaw | 0.0 /100 | #320 | Tragic 80.9% |
| Puerto Ricans | 0.0 /100 | #321 | Tragic 80.7% |
| Paiute | 0.0 /100 | #322 | Tragic 80.6% |
Demographics Similar to Latvians by In Labor Force | Age 35-44
In terms of in labor force | age 35-44, the demographic groups most similar to Latvians are Paraguayan (85.4%, a difference of 0.010%), Immigrants from Liberia (85.4%, a difference of 0.010%), Immigrants from Lithuania (85.4%, a difference of 0.020%), Immigrants from Greece (85.3%, a difference of 0.030%), and Immigrants from Eastern Africa (85.4%, a difference of 0.060%).
| Demographics | Rating | Rank | In Labor Force | Age 35-44 |
| Immigrants | North Macedonia | 100.0 /100 | #17 | Exceptional 85.6% |
| Carpatho Rusyns | 100.0 /100 | #18 | Exceptional 85.6% |
| Slovenes | 100.0 /100 | #19 | Exceptional 85.6% |
| Immigrants | Serbia | 100.0 /100 | #20 | Exceptional 85.5% |
| Bulgarians | 100.0 /100 | #21 | Exceptional 85.5% |
| Immigrants | Bosnia and Herzegovina | 100.0 /100 | #22 | Exceptional 85.4% |
| Immigrants | Eastern Africa | 100.0 /100 | #23 | Exceptional 85.4% |
| Latvians | 99.9 /100 | #24 | Exceptional 85.4% |
| Paraguayans | 99.9 /100 | #25 | Exceptional 85.4% |
| Immigrants | Liberia | 99.9 /100 | #26 | Exceptional 85.4% |
| Immigrants | Lithuania | 99.9 /100 | #27 | Exceptional 85.4% |
| Immigrants | Greece | 99.9 /100 | #28 | Exceptional 85.3% |
| Cambodians | 99.9 /100 | #29 | Exceptional 85.3% |
| Bermudans | 99.9 /100 | #30 | Exceptional 85.3% |
| Czechs | 99.9 /100 | #31 | Exceptional 85.3% |