Immigrants from Lithuania vs Syrian In Labor Force | Age > 16
COMPARE
Immigrants from Lithuania
Syrian
In Labor Force | Age > 16
In Labor Force | Age > 16 Comparison
Immigrants from Lithuania
Syrians
65.6%
IN LABOR FORCE | AGE > 16
93.5/ 100
METRIC RATING
133rd/ 347
METRIC RANK
65.0%
IN LABOR FORCE | AGE > 16
40.0/ 100
METRIC RATING
185th/ 347
METRIC RANK
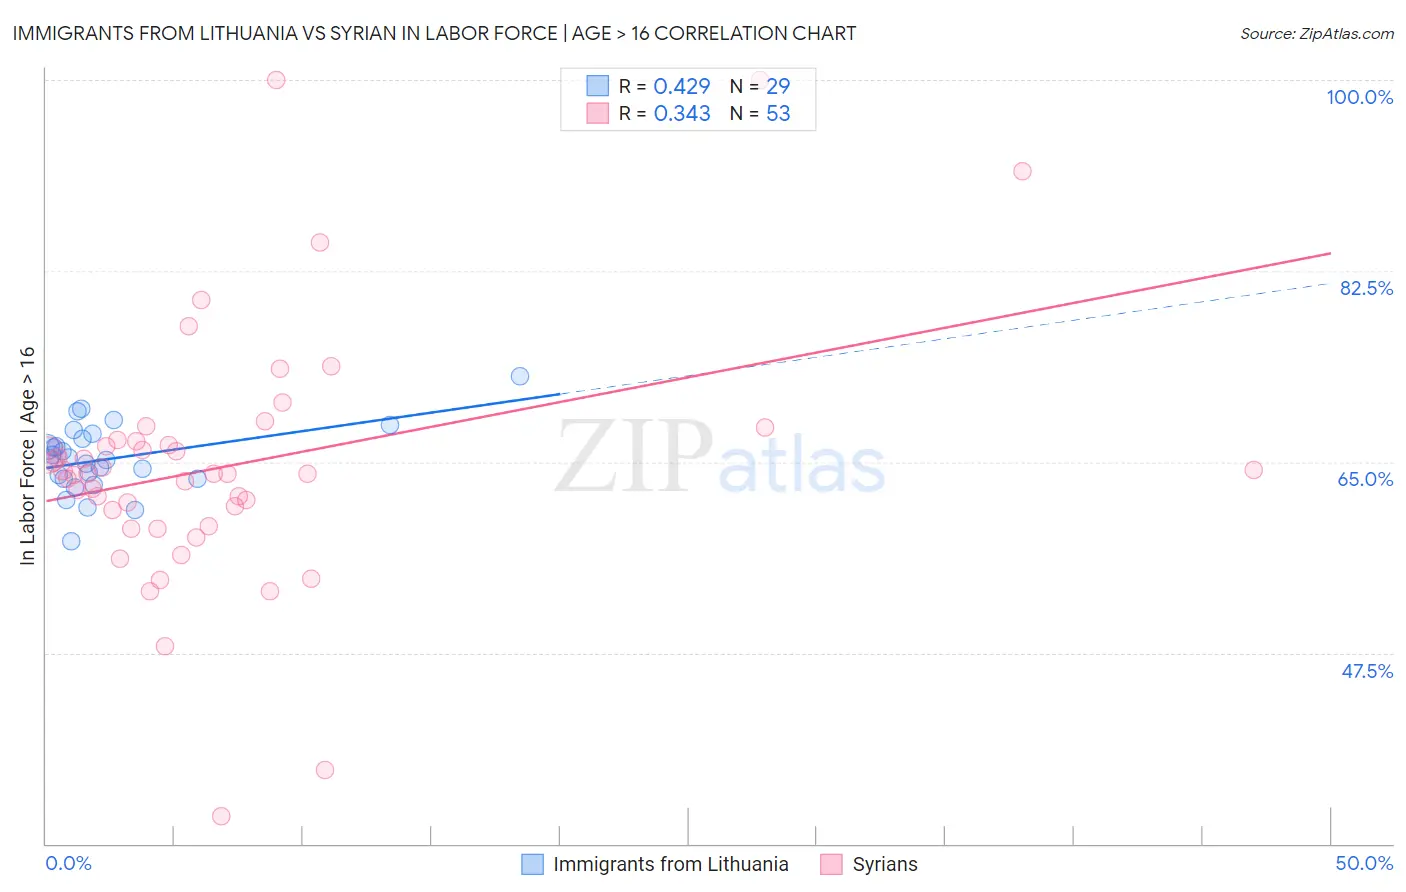
Immigrants from Lithuania vs Syrian In Labor Force | Age > 16 Correlation Chart
The statistical analysis conducted on geographies consisting of 117,714,489 people shows a moderate positive correlation between the proportion of Immigrants from Lithuania and labor force participation rate among population ages 16 and over in the United States with a correlation coefficient (R) of 0.429 and weighted average of 65.6%. Similarly, the statistical analysis conducted on geographies consisting of 266,332,401 people shows a mild positive correlation between the proportion of Syrians and labor force participation rate among population ages 16 and over in the United States with a correlation coefficient (R) of 0.343 and weighted average of 65.0%, a difference of 0.86%.
In Labor Force | Age > 16 Correlation Summary
| Measurement | Immigrants from Lithuania | Syrian |
| Minimum | 57.7% | 32.5% |
| Maximum | 72.8% | 100.0% |
| Range | 15.1% | 67.5% |
| Mean | 65.3% | 64.7% |
| Median | 65.2% | 63.9% |
| Interquartile 25% (IQ1) | 63.5% | 59.8% |
| Interquartile 75% (IQ3) | 67.3% | 67.0% |
| Interquartile Range (IQR) | 3.8% | 7.1% |
| Standard Deviation (Sample) | 3.1% | 11.8% |
| Standard Deviation (Population) | 3.1% | 11.7% |
Similar Demographics by In Labor Force | Age > 16
Demographics Similar to Immigrants from Lithuania by In Labor Force | Age > 16
In terms of in labor force | age > 16, the demographic groups most similar to Immigrants from Lithuania are Costa Rican (65.6%, a difference of 0.010%), Immigrants from North Macedonia (65.6%, a difference of 0.030%), Immigrants from Guatemala (65.6%, a difference of 0.040%), Icelander (65.6%, a difference of 0.040%), and Guatemalan (65.6%, a difference of 0.040%).
| Demographics | Rating | Rank | In Labor Force | Age > 16 |
| Koreans | 95.3 /100 | #126 | Exceptional 65.7% |
| Immigrants | Eastern Asia | 94.9 /100 | #127 | Exceptional 65.7% |
| Ecuadorians | 94.7 /100 | #128 | Exceptional 65.6% |
| Immigrants | Philippines | 94.5 /100 | #129 | Exceptional 65.6% |
| Immigrants | Guatemala | 94.4 /100 | #130 | Exceptional 65.6% |
| Icelanders | 94.3 /100 | #131 | Exceptional 65.6% |
| Immigrants | North Macedonia | 94.1 /100 | #132 | Exceptional 65.6% |
| Immigrants | Lithuania | 93.5 /100 | #133 | Exceptional 65.6% |
| Costa Ricans | 93.2 /100 | #134 | Exceptional 65.6% |
| Guatemalans | 92.5 /100 | #135 | Exceptional 65.6% |
| Immigrants | Argentina | 92.4 /100 | #136 | Exceptional 65.6% |
| Guamanians/Chamorros | 92.4 /100 | #137 | Exceptional 65.6% |
| Immigrants | West Indies | 92.0 /100 | #138 | Exceptional 65.6% |
| Immigrants | Taiwan | 90.8 /100 | #139 | Exceptional 65.5% |
| Immigrants | Costa Rica | 90.8 /100 | #140 | Exceptional 65.5% |
Demographics Similar to Syrians by In Labor Force | Age > 16
In terms of in labor force | age > 16, the demographic groups most similar to Syrians are Carpatho Rusyn (65.0%, a difference of 0.0%), Immigrants from Nicaragua (65.1%, a difference of 0.010%), Soviet Union (65.0%, a difference of 0.010%), Immigrants from Switzerland (65.0%, a difference of 0.020%), and Immigrants from Latvia (65.1%, a difference of 0.030%).
| Demographics | Rating | Rank | In Labor Force | Age > 16 |
| Trinidadians and Tobagonians | 45.2 /100 | #178 | Average 65.1% |
| Immigrants | Haiti | 43.3 /100 | #179 | Average 65.1% |
| Immigrants | Latvia | 42.9 /100 | #180 | Average 65.1% |
| Immigrants | Panama | 42.4 /100 | #181 | Average 65.1% |
| Immigrants | Nicaragua | 41.1 /100 | #182 | Average 65.1% |
| Soviet Union | 40.5 /100 | #183 | Average 65.0% |
| Carpatho Rusyns | 40.0 /100 | #184 | Average 65.0% |
| Syrians | 40.0 /100 | #185 | Average 65.0% |
| Immigrants | Switzerland | 38.2 /100 | #186 | Fair 65.0% |
| Immigrants | Croatia | 35.7 /100 | #187 | Fair 65.0% |
| Immigrants | Portugal | 34.8 /100 | #188 | Fair 65.0% |
| Immigrants | Greece | 34.3 /100 | #189 | Fair 65.0% |
| Barbadians | 33.9 /100 | #190 | Fair 65.0% |
| Scandinavians | 33.7 /100 | #191 | Fair 65.0% |
| Immigrants | Fiji | 33.7 /100 | #192 | Fair 65.0% |