Romanian vs Syrian In Labor Force | Age > 16
COMPARE
Romanian
Syrian
In Labor Force | Age > 16
In Labor Force | Age > 16 Comparison
Romanians
Syrians
65.0%
IN LABOR FORCE | AGE > 16
31.1/ 100
METRIC RATING
195th/ 347
METRIC RANK
65.0%
IN LABOR FORCE | AGE > 16
40.0/ 100
METRIC RATING
185th/ 347
METRIC RANK
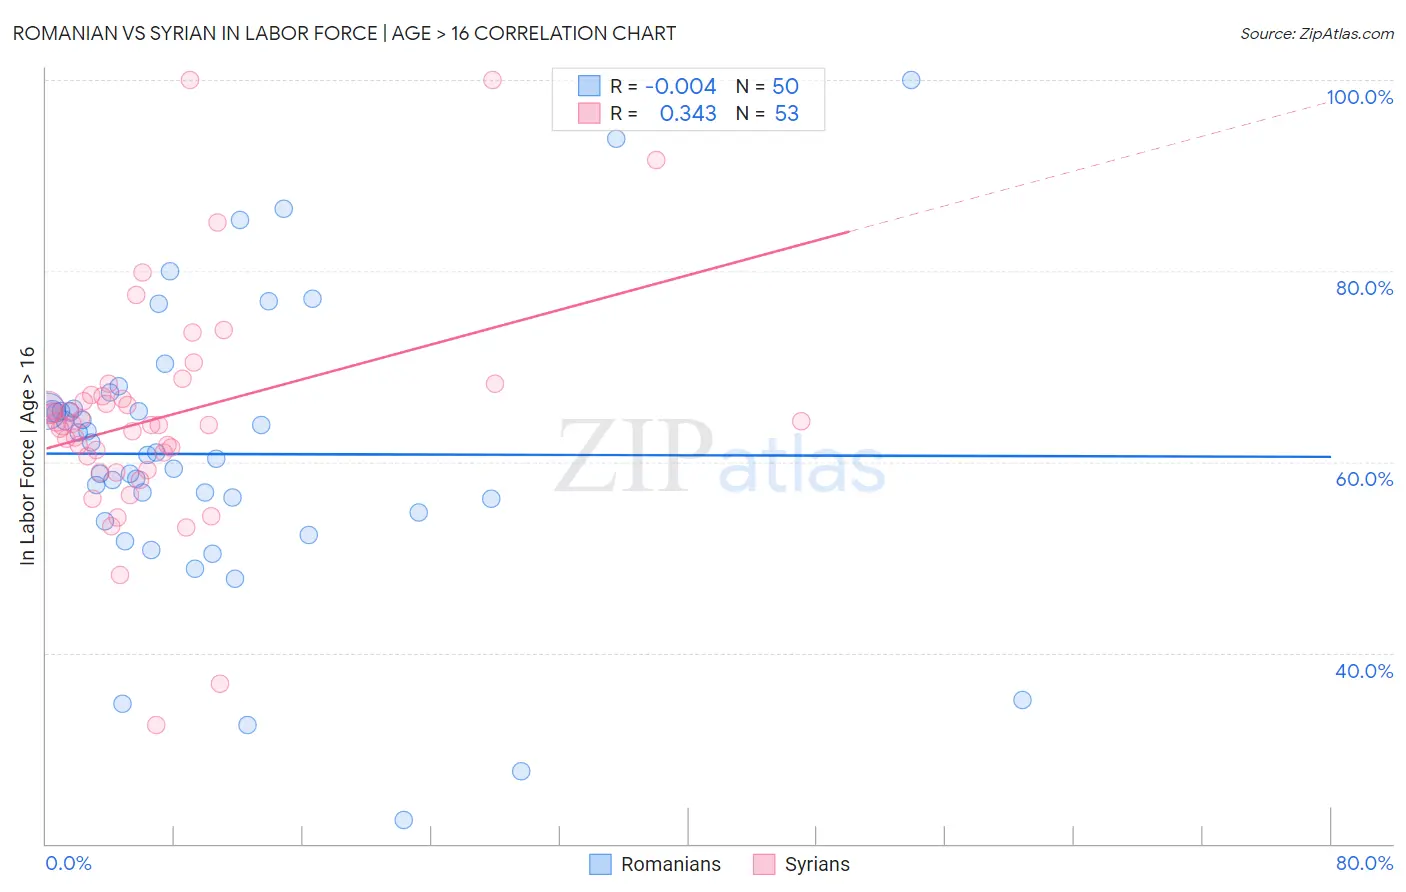
Romanian vs Syrian In Labor Force | Age > 16 Correlation Chart
The statistical analysis conducted on geographies consisting of 377,921,864 people shows no correlation between the proportion of Romanians and labor force participation rate among population ages 16 and over in the United States with a correlation coefficient (R) of -0.004 and weighted average of 65.0%. Similarly, the statistical analysis conducted on geographies consisting of 266,332,401 people shows a mild positive correlation between the proportion of Syrians and labor force participation rate among population ages 16 and over in the United States with a correlation coefficient (R) of 0.343 and weighted average of 65.0%, a difference of 0.11%.
In Labor Force | Age > 16 Correlation Summary
| Measurement | Romanian | Syrian |
| Minimum | 22.5% | 32.5% |
| Maximum | 100.0% | 100.0% |
| Range | 77.5% | 67.5% |
| Mean | 60.8% | 64.7% |
| Median | 60.9% | 63.9% |
| Interquartile 25% (IQ1) | 54.7% | 59.8% |
| Interquartile 75% (IQ3) | 65.3% | 67.0% |
| Interquartile Range (IQR) | 10.6% | 7.1% |
| Standard Deviation (Sample) | 15.0% | 11.8% |
| Standard Deviation (Population) | 14.8% | 11.7% |
Demographics Similar to Romanians and Syrians by In Labor Force | Age > 16
In terms of in labor force | age > 16, the demographic groups most similar to Romanians are Immigrants from Southern Europe (65.0%, a difference of 0.0%), Haitian (65.0%, a difference of 0.010%), Scandinavian (65.0%, a difference of 0.030%), Immigrants from Fiji (65.0%, a difference of 0.030%), and Immigrants from Europe (65.0%, a difference of 0.030%). Similarly, the demographic groups most similar to Syrians are Carpatho Rusyn (65.0%, a difference of 0.0%), Immigrants from Nicaragua (65.1%, a difference of 0.010%), Soviet Union (65.0%, a difference of 0.010%), Immigrants from Switzerland (65.0%, a difference of 0.020%), and Immigrants from Latvia (65.1%, a difference of 0.030%).
| Demographics | Rating | Rank | In Labor Force | Age > 16 |
| Immigrants | Latvia | 42.9 /100 | #180 | Average 65.1% |
| Immigrants | Panama | 42.4 /100 | #181 | Average 65.1% |
| Immigrants | Nicaragua | 41.1 /100 | #182 | Average 65.1% |
| Soviet Union | 40.5 /100 | #183 | Average 65.0% |
| Carpatho Rusyns | 40.0 /100 | #184 | Average 65.0% |
| Syrians | 40.0 /100 | #185 | Average 65.0% |
| Immigrants | Switzerland | 38.2 /100 | #186 | Fair 65.0% |
| Immigrants | Croatia | 35.7 /100 | #187 | Fair 65.0% |
| Immigrants | Portugal | 34.8 /100 | #188 | Fair 65.0% |
| Immigrants | Greece | 34.3 /100 | #189 | Fair 65.0% |
| Barbadians | 33.9 /100 | #190 | Fair 65.0% |
| Scandinavians | 33.7 /100 | #191 | Fair 65.0% |
| Immigrants | Fiji | 33.7 /100 | #192 | Fair 65.0% |
| Immigrants | Europe | 33.6 /100 | #193 | Fair 65.0% |
| Immigrants | Southern Europe | 31.3 /100 | #194 | Fair 65.0% |
| Romanians | 31.1 /100 | #195 | Fair 65.0% |
| Haitians | 30.6 /100 | #196 | Fair 65.0% |
| Immigrants | Italy | 28.7 /100 | #197 | Fair 65.0% |
| Greeks | 26.1 /100 | #198 | Fair 64.9% |
| Mexican American Indians | 23.1 /100 | #199 | Fair 64.9% |
| Armenians | 20.2 /100 | #200 | Fair 64.9% |