Portuguese vs Syrian In Labor Force | Age > 16
COMPARE
Portuguese
Syrian
In Labor Force | Age > 16
In Labor Force | Age > 16 Comparison
Portuguese
Syrians
64.4%
IN LABOR FORCE | AGE > 16
1.6/ 100
METRIC RATING
251st/ 347
METRIC RANK
65.0%
IN LABOR FORCE | AGE > 16
40.0/ 100
METRIC RATING
185th/ 347
METRIC RANK
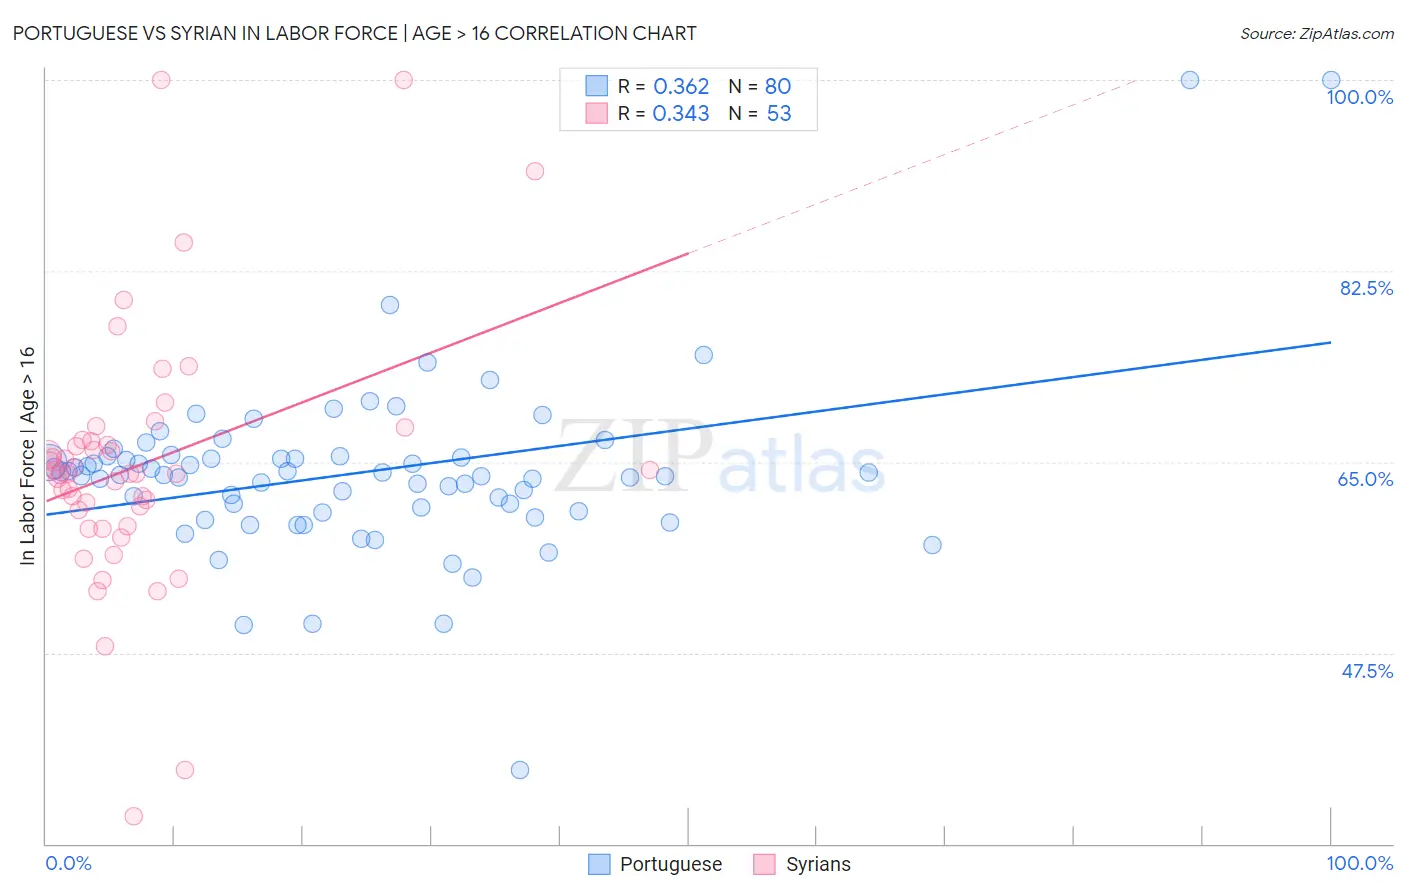
Portuguese vs Syrian In Labor Force | Age > 16 Correlation Chart
The statistical analysis conducted on geographies consisting of 450,362,243 people shows a mild positive correlation between the proportion of Portuguese and labor force participation rate among population ages 16 and over in the United States with a correlation coefficient (R) of 0.362 and weighted average of 64.4%. Similarly, the statistical analysis conducted on geographies consisting of 266,332,401 people shows a mild positive correlation between the proportion of Syrians and labor force participation rate among population ages 16 and over in the United States with a correlation coefficient (R) of 0.343 and weighted average of 65.0%, a difference of 1.0%.
In Labor Force | Age > 16 Correlation Summary
| Measurement | Portuguese | Syrian |
| Minimum | 36.8% | 32.5% |
| Maximum | 100.0% | 100.0% |
| Range | 63.2% | 67.5% |
| Mean | 64.0% | 64.7% |
| Median | 63.8% | 63.9% |
| Interquartile 25% (IQ1) | 60.7% | 59.8% |
| Interquartile 75% (IQ3) | 65.4% | 67.0% |
| Interquartile Range (IQR) | 4.8% | 7.1% |
| Standard Deviation (Sample) | 8.2% | 11.8% |
| Standard Deviation (Population) | 8.2% | 11.7% |
Similar Demographics by In Labor Force | Age > 16
Demographics Similar to Portuguese by In Labor Force | Age > 16
In terms of in labor force | age > 16, the demographic groups most similar to Portuguese are British West Indian (64.4%, a difference of 0.020%), German (64.4%, a difference of 0.030%), Immigrants from Dominican Republic (64.4%, a difference of 0.030%), Czechoslovakian (64.3%, a difference of 0.040%), and Immigrants from Uzbekistan (64.3%, a difference of 0.040%).
| Demographics | Rating | Rank | In Labor Force | Age > 16 |
| Tsimshian | 3.1 /100 | #244 | Tragic 64.5% |
| West Indians | 3.0 /100 | #245 | Tragic 64.5% |
| Immigrants | Caribbean | 2.3 /100 | #246 | Tragic 64.4% |
| Swiss | 2.1 /100 | #247 | Tragic 64.4% |
| Immigrants | Barbados | 2.1 /100 | #248 | Tragic 64.4% |
| Germans | 1.8 /100 | #249 | Tragic 64.4% |
| British West Indians | 1.8 /100 | #250 | Tragic 64.4% |
| Portuguese | 1.6 /100 | #251 | Tragic 64.4% |
| Immigrants | Dominican Republic | 1.5 /100 | #252 | Tragic 64.4% |
| Czechoslovakians | 1.4 /100 | #253 | Tragic 64.3% |
| Immigrants | Uzbekistan | 1.4 /100 | #254 | Tragic 64.3% |
| Hispanics or Latinos | 1.1 /100 | #255 | Tragic 64.3% |
| Immigrants | Mexico | 1.0 /100 | #256 | Tragic 64.3% |
| Inupiat | 0.8 /100 | #257 | Tragic 64.3% |
| Immigrants | Scotland | 0.8 /100 | #258 | Tragic 64.2% |
Demographics Similar to Syrians by In Labor Force | Age > 16
In terms of in labor force | age > 16, the demographic groups most similar to Syrians are Carpatho Rusyn (65.0%, a difference of 0.0%), Immigrants from Nicaragua (65.1%, a difference of 0.010%), Soviet Union (65.0%, a difference of 0.010%), Immigrants from Switzerland (65.0%, a difference of 0.020%), and Immigrants from Latvia (65.1%, a difference of 0.030%).
| Demographics | Rating | Rank | In Labor Force | Age > 16 |
| Trinidadians and Tobagonians | 45.2 /100 | #178 | Average 65.1% |
| Immigrants | Haiti | 43.3 /100 | #179 | Average 65.1% |
| Immigrants | Latvia | 42.9 /100 | #180 | Average 65.1% |
| Immigrants | Panama | 42.4 /100 | #181 | Average 65.1% |
| Immigrants | Nicaragua | 41.1 /100 | #182 | Average 65.1% |
| Soviet Union | 40.5 /100 | #183 | Average 65.0% |
| Carpatho Rusyns | 40.0 /100 | #184 | Average 65.0% |
| Syrians | 40.0 /100 | #185 | Average 65.0% |
| Immigrants | Switzerland | 38.2 /100 | #186 | Fair 65.0% |
| Immigrants | Croatia | 35.7 /100 | #187 | Fair 65.0% |
| Immigrants | Portugal | 34.8 /100 | #188 | Fair 65.0% |
| Immigrants | Greece | 34.3 /100 | #189 | Fair 65.0% |
| Barbadians | 33.9 /100 | #190 | Fair 65.0% |
| Scandinavians | 33.7 /100 | #191 | Fair 65.0% |
| Immigrants | Fiji | 33.7 /100 | #192 | Fair 65.0% |