Immigrants from Lithuania vs Greek In Labor Force | Age > 16
COMPARE
Immigrants from Lithuania
Greek
In Labor Force | Age > 16
In Labor Force | Age > 16 Comparison
Immigrants from Lithuania
Greeks
65.6%
IN LABOR FORCE | AGE > 16
93.5/ 100
METRIC RATING
133rd/ 347
METRIC RANK
64.9%
IN LABOR FORCE | AGE > 16
26.1/ 100
METRIC RATING
198th/ 347
METRIC RANK
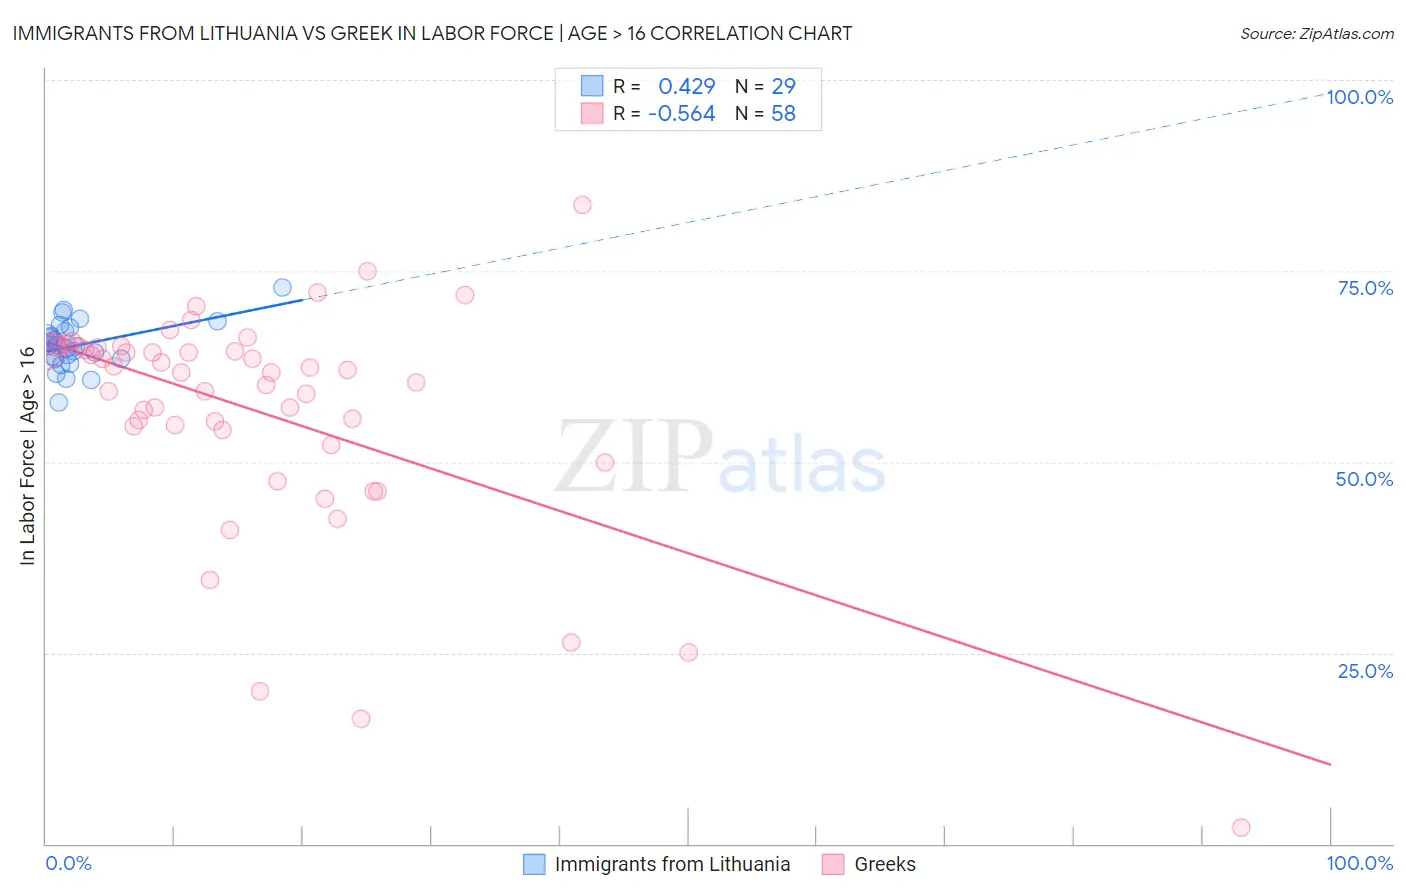
Immigrants from Lithuania vs Greek In Labor Force | Age > 16 Correlation Chart
The statistical analysis conducted on geographies consisting of 117,714,489 people shows a moderate positive correlation between the proportion of Immigrants from Lithuania and labor force participation rate among population ages 16 and over in the United States with a correlation coefficient (R) of 0.429 and weighted average of 65.6%. Similarly, the statistical analysis conducted on geographies consisting of 482,783,671 people shows a substantial negative correlation between the proportion of Greeks and labor force participation rate among population ages 16 and over in the United States with a correlation coefficient (R) of -0.564 and weighted average of 64.9%, a difference of 1.0%.
In Labor Force | Age > 16 Correlation Summary
| Measurement | Immigrants from Lithuania | Greek |
| Minimum | 57.7% | 2.1% |
| Maximum | 72.8% | 83.6% |
| Range | 15.1% | 81.5% |
| Mean | 65.3% | 56.5% |
| Median | 65.2% | 61.7% |
| Interquartile 25% (IQ1) | 63.5% | 54.1% |
| Interquartile 75% (IQ3) | 67.3% | 65.0% |
| Interquartile Range (IQR) | 3.8% | 10.9% |
| Standard Deviation (Sample) | 3.1% | 14.9% |
| Standard Deviation (Population) | 3.1% | 14.8% |
Similar Demographics by In Labor Force | Age > 16
Demographics Similar to Immigrants from Lithuania by In Labor Force | Age > 16
In terms of in labor force | age > 16, the demographic groups most similar to Immigrants from Lithuania are Costa Rican (65.6%, a difference of 0.010%), Immigrants from North Macedonia (65.6%, a difference of 0.030%), Immigrants from Guatemala (65.6%, a difference of 0.040%), Icelander (65.6%, a difference of 0.040%), and Guatemalan (65.6%, a difference of 0.040%).
| Demographics | Rating | Rank | In Labor Force | Age > 16 |
| Koreans | 95.3 /100 | #126 | Exceptional 65.7% |
| Immigrants | Eastern Asia | 94.9 /100 | #127 | Exceptional 65.7% |
| Ecuadorians | 94.7 /100 | #128 | Exceptional 65.6% |
| Immigrants | Philippines | 94.5 /100 | #129 | Exceptional 65.6% |
| Immigrants | Guatemala | 94.4 /100 | #130 | Exceptional 65.6% |
| Icelanders | 94.3 /100 | #131 | Exceptional 65.6% |
| Immigrants | North Macedonia | 94.1 /100 | #132 | Exceptional 65.6% |
| Immigrants | Lithuania | 93.5 /100 | #133 | Exceptional 65.6% |
| Costa Ricans | 93.2 /100 | #134 | Exceptional 65.6% |
| Guatemalans | 92.5 /100 | #135 | Exceptional 65.6% |
| Immigrants | Argentina | 92.4 /100 | #136 | Exceptional 65.6% |
| Guamanians/Chamorros | 92.4 /100 | #137 | Exceptional 65.6% |
| Immigrants | West Indies | 92.0 /100 | #138 | Exceptional 65.6% |
| Immigrants | Taiwan | 90.8 /100 | #139 | Exceptional 65.5% |
| Immigrants | Costa Rica | 90.8 /100 | #140 | Exceptional 65.5% |
Demographics Similar to Greeks by In Labor Force | Age > 16
In terms of in labor force | age > 16, the demographic groups most similar to Greeks are Immigrants from Italy (65.0%, a difference of 0.040%), Mexican American Indian (64.9%, a difference of 0.050%), Haitian (65.0%, a difference of 0.060%), Immigrants from Southern Europe (65.0%, a difference of 0.070%), and Romanian (65.0%, a difference of 0.070%).
| Demographics | Rating | Rank | In Labor Force | Age > 16 |
| Scandinavians | 33.7 /100 | #191 | Fair 65.0% |
| Immigrants | Fiji | 33.7 /100 | #192 | Fair 65.0% |
| Immigrants | Europe | 33.6 /100 | #193 | Fair 65.0% |
| Immigrants | Southern Europe | 31.3 /100 | #194 | Fair 65.0% |
| Romanians | 31.1 /100 | #195 | Fair 65.0% |
| Haitians | 30.6 /100 | #196 | Fair 65.0% |
| Immigrants | Italy | 28.7 /100 | #197 | Fair 65.0% |
| Greeks | 26.1 /100 | #198 | Fair 64.9% |
| Mexican American Indians | 23.1 /100 | #199 | Fair 64.9% |
| Armenians | 20.2 /100 | #200 | Fair 64.9% |
| Ukrainians | 19.6 /100 | #201 | Poor 64.9% |
| Immigrants | Belgium | 19.4 /100 | #202 | Poor 64.9% |
| Russians | 18.8 /100 | #203 | Poor 64.9% |
| Slovenes | 18.7 /100 | #204 | Poor 64.9% |
| Jamaicans | 18.7 /100 | #205 | Poor 64.9% |