Immigrants from Vietnam vs Syrian In Labor Force | Age > 16
COMPARE
Immigrants from Vietnam
Syrian
In Labor Force | Age > 16
In Labor Force | Age > 16 Comparison
Immigrants from Vietnam
Syrians
66.2%
IN LABOR FORCE | AGE > 16
99.7/ 100
METRIC RATING
73rd/ 347
METRIC RANK
65.0%
IN LABOR FORCE | AGE > 16
40.0/ 100
METRIC RATING
185th/ 347
METRIC RANK
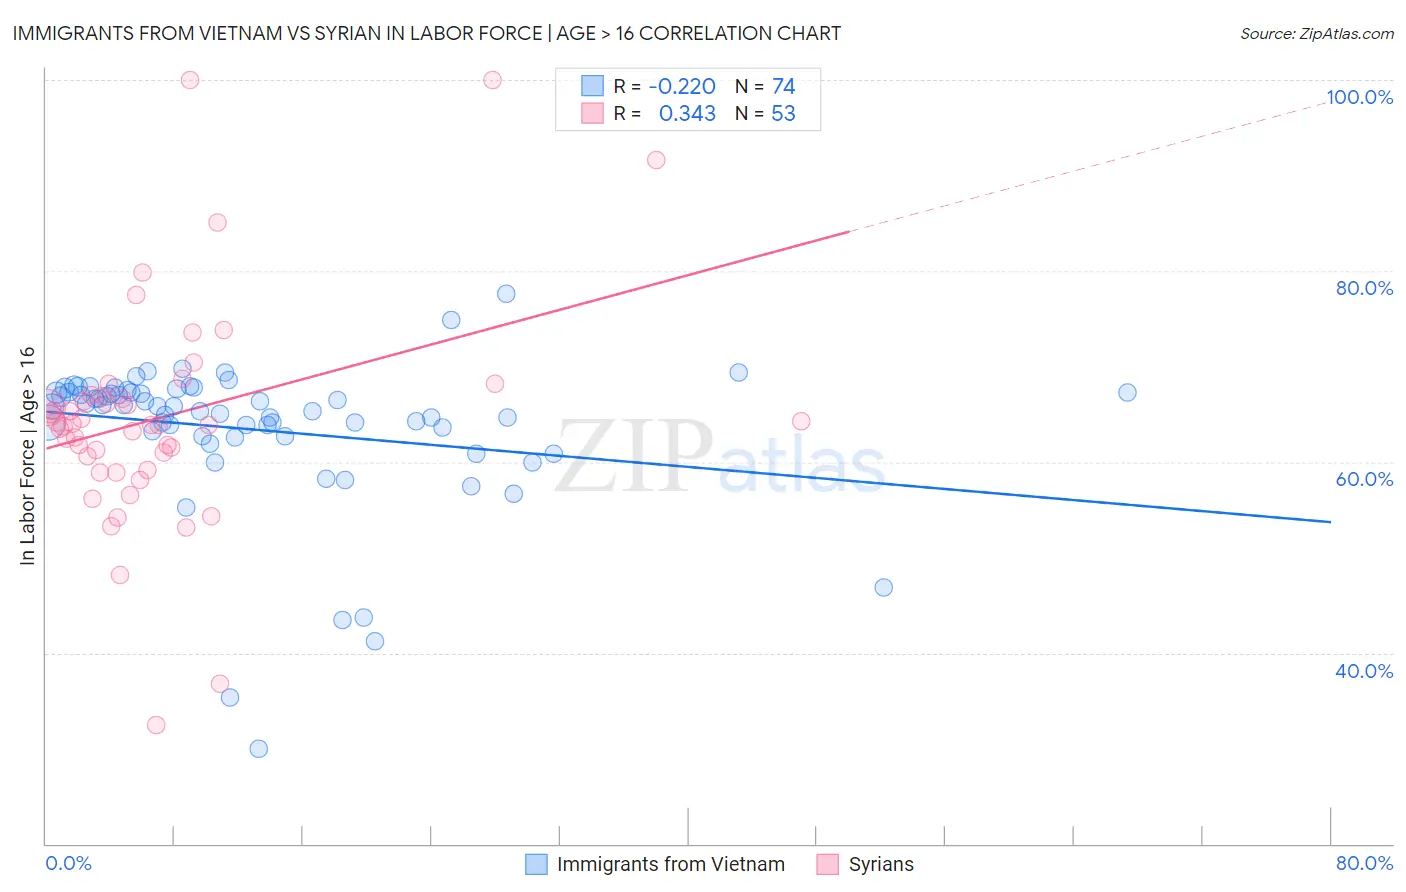
Immigrants from Vietnam vs Syrian In Labor Force | Age > 16 Correlation Chart
The statistical analysis conducted on geographies consisting of 404,839,190 people shows a weak negative correlation between the proportion of Immigrants from Vietnam and labor force participation rate among population ages 16 and over in the United States with a correlation coefficient (R) of -0.220 and weighted average of 66.2%. Similarly, the statistical analysis conducted on geographies consisting of 266,332,401 people shows a mild positive correlation between the proportion of Syrians and labor force participation rate among population ages 16 and over in the United States with a correlation coefficient (R) of 0.343 and weighted average of 65.0%, a difference of 1.7%.
In Labor Force | Age > 16 Correlation Summary
| Measurement | Immigrants from Vietnam | Syrian |
| Minimum | 30.0% | 32.5% |
| Maximum | 77.6% | 100.0% |
| Range | 47.6% | 67.5% |
| Mean | 63.4% | 64.7% |
| Median | 65.8% | 63.9% |
| Interquartile 25% (IQ1) | 62.7% | 59.8% |
| Interquartile 75% (IQ3) | 67.3% | 67.0% |
| Interquartile Range (IQR) | 4.6% | 7.1% |
| Standard Deviation (Sample) | 8.0% | 11.8% |
| Standard Deviation (Population) | 7.9% | 11.7% |
Similar Demographics by In Labor Force | Age > 16
Demographics Similar to Immigrants from Vietnam by In Labor Force | Age > 16
In terms of in labor force | age > 16, the demographic groups most similar to Immigrants from Vietnam are Immigrants from Korea (66.2%, a difference of 0.0%), Burmese (66.2%, a difference of 0.010%), Taiwanese (66.2%, a difference of 0.010%), Immigrants from Singapore (66.2%, a difference of 0.010%), and Asian (66.2%, a difference of 0.030%).
| Demographics | Rating | Rank | In Labor Force | Age > 16 |
| Jordanians | 99.8 /100 | #66 | Exceptional 66.3% |
| Egyptians | 99.8 /100 | #67 | Exceptional 66.2% |
| Immigrants | Egypt | 99.7 /100 | #68 | Exceptional 66.2% |
| Sub-Saharan Africans | 99.7 /100 | #69 | Exceptional 66.2% |
| Asians | 99.7 /100 | #70 | Exceptional 66.2% |
| Burmese | 99.7 /100 | #71 | Exceptional 66.2% |
| Taiwanese | 99.7 /100 | #72 | Exceptional 66.2% |
| Immigrants | Vietnam | 99.7 /100 | #73 | Exceptional 66.2% |
| Immigrants | Korea | 99.7 /100 | #74 | Exceptional 66.2% |
| Immigrants | Singapore | 99.7 /100 | #75 | Exceptional 66.2% |
| Immigrants | Malaysia | 99.6 /100 | #76 | Exceptional 66.1% |
| Immigrants | Moldova | 99.6 /100 | #77 | Exceptional 66.1% |
| Immigrants | Asia | 99.6 /100 | #78 | Exceptional 66.1% |
| Turks | 99.6 /100 | #79 | Exceptional 66.1% |
| Malaysians | 99.6 /100 | #80 | Exceptional 66.1% |
Demographics Similar to Syrians by In Labor Force | Age > 16
In terms of in labor force | age > 16, the demographic groups most similar to Syrians are Carpatho Rusyn (65.0%, a difference of 0.0%), Immigrants from Nicaragua (65.1%, a difference of 0.010%), Soviet Union (65.0%, a difference of 0.010%), Immigrants from Switzerland (65.0%, a difference of 0.020%), and Immigrants from Latvia (65.1%, a difference of 0.030%).
| Demographics | Rating | Rank | In Labor Force | Age > 16 |
| Trinidadians and Tobagonians | 45.2 /100 | #178 | Average 65.1% |
| Immigrants | Haiti | 43.3 /100 | #179 | Average 65.1% |
| Immigrants | Latvia | 42.9 /100 | #180 | Average 65.1% |
| Immigrants | Panama | 42.4 /100 | #181 | Average 65.1% |
| Immigrants | Nicaragua | 41.1 /100 | #182 | Average 65.1% |
| Soviet Union | 40.5 /100 | #183 | Average 65.0% |
| Carpatho Rusyns | 40.0 /100 | #184 | Average 65.0% |
| Syrians | 40.0 /100 | #185 | Average 65.0% |
| Immigrants | Switzerland | 38.2 /100 | #186 | Fair 65.0% |
| Immigrants | Croatia | 35.7 /100 | #187 | Fair 65.0% |
| Immigrants | Portugal | 34.8 /100 | #188 | Fair 65.0% |
| Immigrants | Greece | 34.3 /100 | #189 | Fair 65.0% |
| Barbadians | 33.9 /100 | #190 | Fair 65.0% |
| Scandinavians | 33.7 /100 | #191 | Fair 65.0% |
| Immigrants | Fiji | 33.7 /100 | #192 | Fair 65.0% |