Immigrants from Liberia vs Argentinean In Labor Force | Age 20-24
COMPARE
Immigrants from Liberia
Argentinean
In Labor Force | Age 20-24
In Labor Force | Age 20-24 Comparison
Immigrants from Liberia
Argentineans
77.1%
IN LABOR FORCE | AGE 20-24
99.9/ 100
METRIC RATING
55th/ 347
METRIC RANK
73.1%
IN LABOR FORCE | AGE 20-24
0.1/ 100
METRIC RATING
288th/ 347
METRIC RANK
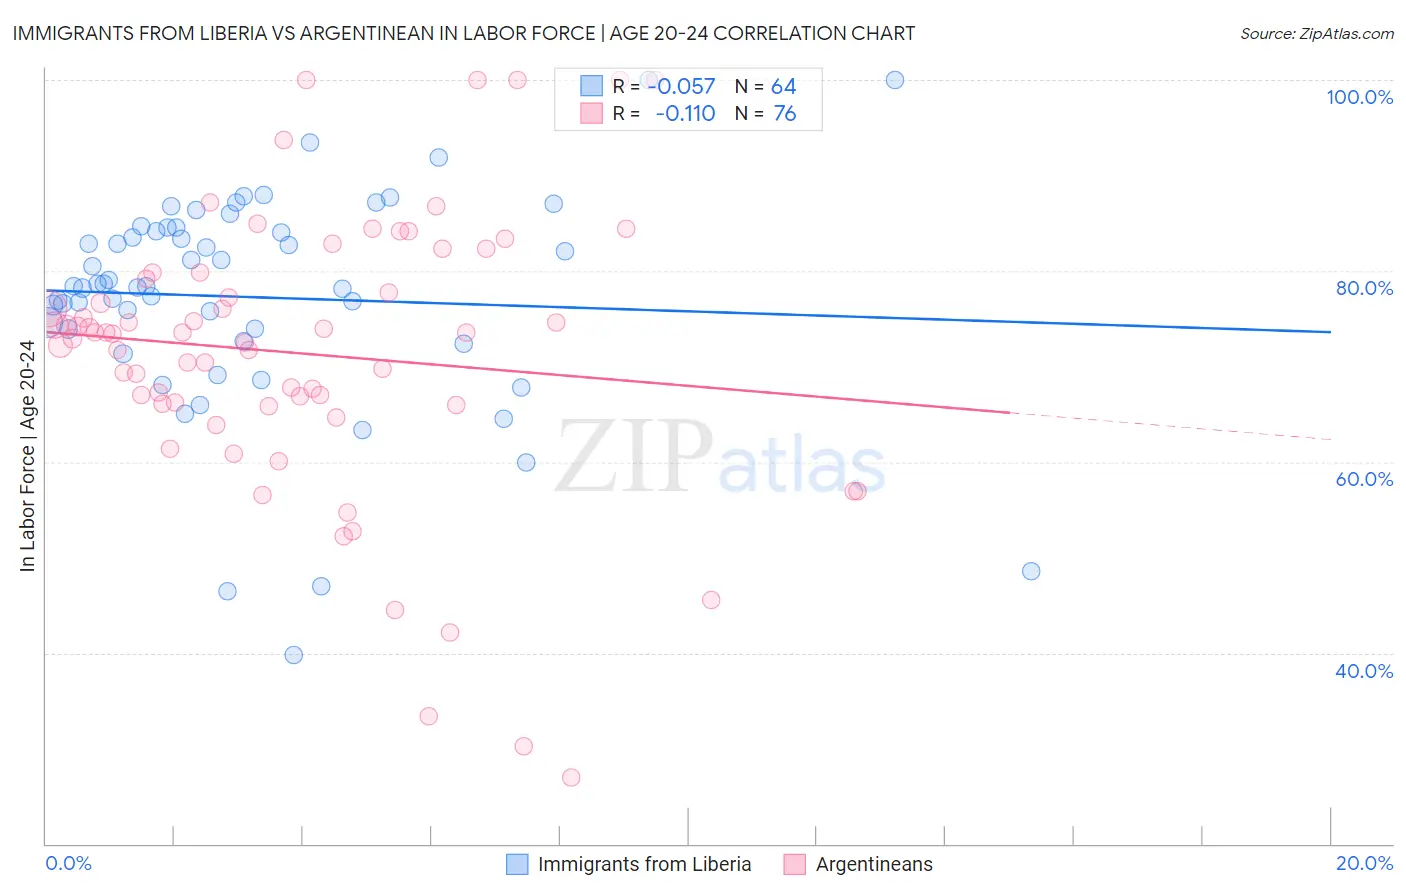
Immigrants from Liberia vs Argentinean In Labor Force | Age 20-24 Correlation Chart
The statistical analysis conducted on geographies consisting of 135,280,504 people shows a slight negative correlation between the proportion of Immigrants from Liberia and labor force participation rate among population between the ages 20 and 24 in the United States with a correlation coefficient (R) of -0.057 and weighted average of 77.1%. Similarly, the statistical analysis conducted on geographies consisting of 297,088,097 people shows a poor negative correlation between the proportion of Argentineans and labor force participation rate among population between the ages 20 and 24 in the United States with a correlation coefficient (R) of -0.110 and weighted average of 73.1%, a difference of 5.5%.
In Labor Force | Age 20-24 Correlation Summary
| Measurement | Immigrants from Liberia | Argentinean |
| Minimum | 39.8% | 26.9% |
| Maximum | 100.0% | 100.0% |
| Range | 60.2% | 73.1% |
| Mean | 77.3% | 71.3% |
| Median | 78.4% | 73.5% |
| Interquartile 25% (IQ1) | 73.3% | 66.1% |
| Interquartile 75% (IQ3) | 84.3% | 79.5% |
| Interquartile Range (IQR) | 11.1% | 13.4% |
| Standard Deviation (Sample) | 11.5% | 14.9% |
| Standard Deviation (Population) | 11.4% | 14.8% |
Similar Demographics by In Labor Force | Age 20-24
Demographics Similar to Immigrants from Liberia by In Labor Force | Age 20-24
In terms of in labor force | age 20-24, the demographic groups most similar to Immigrants from Liberia are European (77.1%, a difference of 0.010%), Celtic (77.1%, a difference of 0.020%), Chippewa (77.1%, a difference of 0.020%), Hawaiian (77.0%, a difference of 0.040%), and Scotch-Irish (77.0%, a difference of 0.070%).
| Demographics | Rating | Rank | In Labor Force | Age 20-24 |
| Serbians | 100.0 /100 | #48 | Exceptional 77.3% |
| Chinese | 100.0 /100 | #49 | Exceptional 77.3% |
| Malaysians | 100.0 /100 | #50 | Exceptional 77.2% |
| Croatians | 100.0 /100 | #51 | Exceptional 77.2% |
| Indonesians | 100.0 /100 | #52 | Exceptional 77.2% |
| Immigrants | Azores | 100.0 /100 | #53 | Exceptional 77.2% |
| Celtics | 99.9 /100 | #54 | Exceptional 77.1% |
| Immigrants | Liberia | 99.9 /100 | #55 | Exceptional 77.1% |
| Europeans | 99.9 /100 | #56 | Exceptional 77.1% |
| Chippewa | 99.9 /100 | #57 | Exceptional 77.1% |
| Hawaiians | 99.9 /100 | #58 | Exceptional 77.0% |
| Scotch-Irish | 99.9 /100 | #59 | Exceptional 77.0% |
| Kenyans | 99.9 /100 | #60 | Exceptional 77.0% |
| Immigrants | Eritrea | 99.9 /100 | #61 | Exceptional 77.0% |
| Immigrants | Kenya | 99.9 /100 | #62 | Exceptional 77.0% |
Demographics Similar to Argentineans by In Labor Force | Age 20-24
In terms of in labor force | age 20-24, the demographic groups most similar to Argentineans are U.S. Virgin Islander (73.0%, a difference of 0.030%), Immigrants from Korea (73.1%, a difference of 0.080%), Immigrants from Lebanon (73.1%, a difference of 0.10%), Immigrants from Belarus (73.0%, a difference of 0.11%), and Nicaraguan (73.2%, a difference of 0.13%).
| Demographics | Rating | Rank | In Labor Force | Age 20-24 |
| Immigrants | Venezuela | 0.1 /100 | #281 | Tragic 73.2% |
| Immigrants | Spain | 0.1 /100 | #282 | Tragic 73.2% |
| Immigrants | Bahamas | 0.1 /100 | #283 | Tragic 73.2% |
| Kiowa | 0.1 /100 | #284 | Tragic 73.2% |
| Nicaraguans | 0.1 /100 | #285 | Tragic 73.2% |
| Immigrants | Lebanon | 0.1 /100 | #286 | Tragic 73.1% |
| Immigrants | Korea | 0.1 /100 | #287 | Tragic 73.1% |
| Argentineans | 0.1 /100 | #288 | Tragic 73.1% |
| U.S. Virgin Islanders | 0.1 /100 | #289 | Tragic 73.0% |
| Immigrants | Belarus | 0.1 /100 | #290 | Tragic 73.0% |
| Immigrants | Nicaragua | 0.0 /100 | #291 | Tragic 72.9% |
| Pueblo | 0.0 /100 | #292 | Tragic 72.9% |
| Immigrants | Belize | 0.0 /100 | #293 | Tragic 72.8% |
| Immigrants | Argentina | 0.0 /100 | #294 | Tragic 72.8% |
| Okinawans | 0.0 /100 | #295 | Tragic 72.7% |