Immigrants from Liberia vs Immigrants from Central America In Labor Force | Age 20-24
COMPARE
Immigrants from Liberia
Immigrants from Central America
In Labor Force | Age 20-24
In Labor Force | Age 20-24 Comparison
Immigrants from Liberia
Immigrants from Central America
77.1%
IN LABOR FORCE | AGE 20-24
99.9/ 100
METRIC RATING
55th/ 347
METRIC RANK
75.0%
IN LABOR FORCE | AGE 20-24
45.0/ 100
METRIC RATING
178th/ 347
METRIC RANK
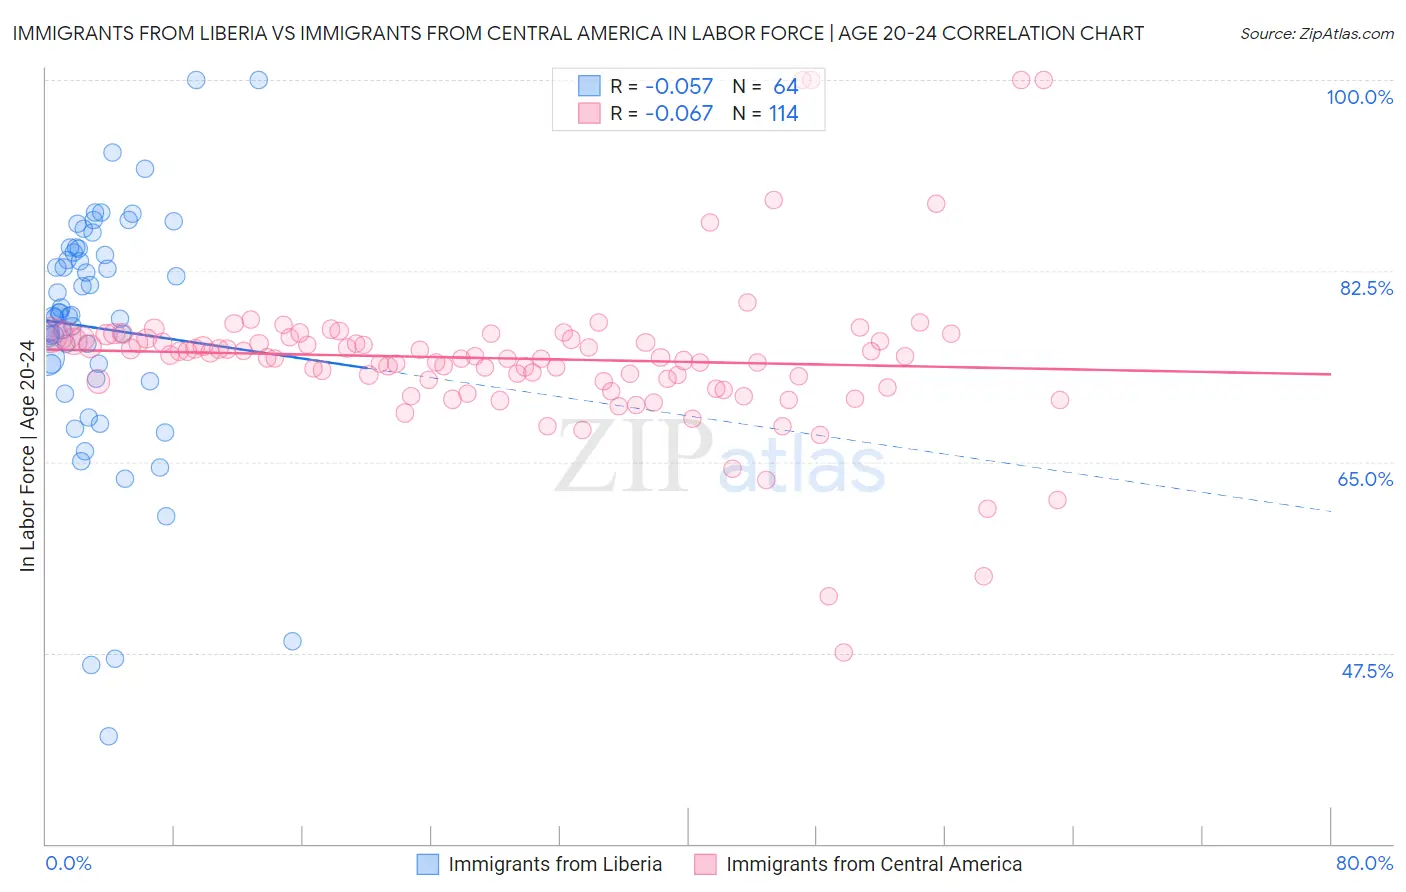
Immigrants from Liberia vs Immigrants from Central America In Labor Force | Age 20-24 Correlation Chart
The statistical analysis conducted on geographies consisting of 135,280,504 people shows a slight negative correlation between the proportion of Immigrants from Liberia and labor force participation rate among population between the ages 20 and 24 in the United States with a correlation coefficient (R) of -0.057 and weighted average of 77.1%. Similarly, the statistical analysis conducted on geographies consisting of 535,780,199 people shows a slight negative correlation between the proportion of Immigrants from Central America and labor force participation rate among population between the ages 20 and 24 in the United States with a correlation coefficient (R) of -0.067 and weighted average of 75.0%, a difference of 2.8%.
In Labor Force | Age 20-24 Correlation Summary
| Measurement | Immigrants from Liberia | Immigrants from Central America |
| Minimum | 39.8% | 47.5% |
| Maximum | 100.0% | 100.0% |
| Range | 60.2% | 52.5% |
| Mean | 77.3% | 74.5% |
| Median | 78.4% | 74.6% |
| Interquartile 25% (IQ1) | 73.3% | 72.4% |
| Interquartile 75% (IQ3) | 84.3% | 76.3% |
| Interquartile Range (IQR) | 11.1% | 4.0% |
| Standard Deviation (Sample) | 11.5% | 7.3% |
| Standard Deviation (Population) | 11.4% | 7.3% |
Similar Demographics by In Labor Force | Age 20-24
Demographics Similar to Immigrants from Liberia by In Labor Force | Age 20-24
In terms of in labor force | age 20-24, the demographic groups most similar to Immigrants from Liberia are European (77.1%, a difference of 0.010%), Celtic (77.1%, a difference of 0.020%), Chippewa (77.1%, a difference of 0.020%), Hawaiian (77.0%, a difference of 0.040%), and Scotch-Irish (77.0%, a difference of 0.070%).
| Demographics | Rating | Rank | In Labor Force | Age 20-24 |
| Serbians | 100.0 /100 | #48 | Exceptional 77.3% |
| Chinese | 100.0 /100 | #49 | Exceptional 77.3% |
| Malaysians | 100.0 /100 | #50 | Exceptional 77.2% |
| Croatians | 100.0 /100 | #51 | Exceptional 77.2% |
| Indonesians | 100.0 /100 | #52 | Exceptional 77.2% |
| Immigrants | Azores | 100.0 /100 | #53 | Exceptional 77.2% |
| Celtics | 99.9 /100 | #54 | Exceptional 77.1% |
| Immigrants | Liberia | 99.9 /100 | #55 | Exceptional 77.1% |
| Europeans | 99.9 /100 | #56 | Exceptional 77.1% |
| Chippewa | 99.9 /100 | #57 | Exceptional 77.1% |
| Hawaiians | 99.9 /100 | #58 | Exceptional 77.0% |
| Scotch-Irish | 99.9 /100 | #59 | Exceptional 77.0% |
| Kenyans | 99.9 /100 | #60 | Exceptional 77.0% |
| Immigrants | Eritrea | 99.9 /100 | #61 | Exceptional 77.0% |
| Immigrants | Kenya | 99.9 /100 | #62 | Exceptional 77.0% |
Demographics Similar to Immigrants from Central America by In Labor Force | Age 20-24
In terms of in labor force | age 20-24, the demographic groups most similar to Immigrants from Central America are Immigrants from Latvia (75.0%, a difference of 0.010%), Immigrants from Czechoslovakia (75.0%, a difference of 0.010%), Immigrants from Mexico (75.0%, a difference of 0.040%), African (75.0%, a difference of 0.040%), and Central American (75.0%, a difference of 0.050%).
| Demographics | Rating | Rank | In Labor Force | Age 20-24 |
| Cajuns | 51.1 /100 | #171 | Average 75.1% |
| Yakama | 50.8 /100 | #172 | Average 75.1% |
| Immigrants | Croatia | 50.2 /100 | #173 | Average 75.1% |
| South Africans | 50.0 /100 | #174 | Average 75.0% |
| Syrians | 49.5 /100 | #175 | Average 75.0% |
| Central Americans | 48.7 /100 | #176 | Average 75.0% |
| Immigrants | Mexico | 47.8 /100 | #177 | Average 75.0% |
| Immigrants | Central America | 45.0 /100 | #178 | Average 75.0% |
| Immigrants | Latvia | 44.1 /100 | #179 | Average 75.0% |
| Immigrants | Czechoslovakia | 44.0 /100 | #180 | Average 75.0% |
| Africans | 42.5 /100 | #181 | Average 75.0% |
| Immigrants | South Africa | 36.9 /100 | #182 | Fair 74.9% |
| Immigrants | Costa Rica | 36.7 /100 | #183 | Fair 74.9% |
| Immigrants | Hungary | 35.0 /100 | #184 | Fair 74.9% |
| Sri Lankans | 34.9 /100 | #185 | Fair 74.9% |