Blackfeet vs Argentinean In Labor Force | Age 20-24
COMPARE
Blackfeet
Argentinean
In Labor Force | Age 20-24
In Labor Force | Age 20-24 Comparison
Blackfeet
Argentineans
75.5%
IN LABOR FORCE | AGE 20-24
83.6/ 100
METRIC RATING
142nd/ 347
METRIC RANK
73.1%
IN LABOR FORCE | AGE 20-24
0.1/ 100
METRIC RATING
288th/ 347
METRIC RANK
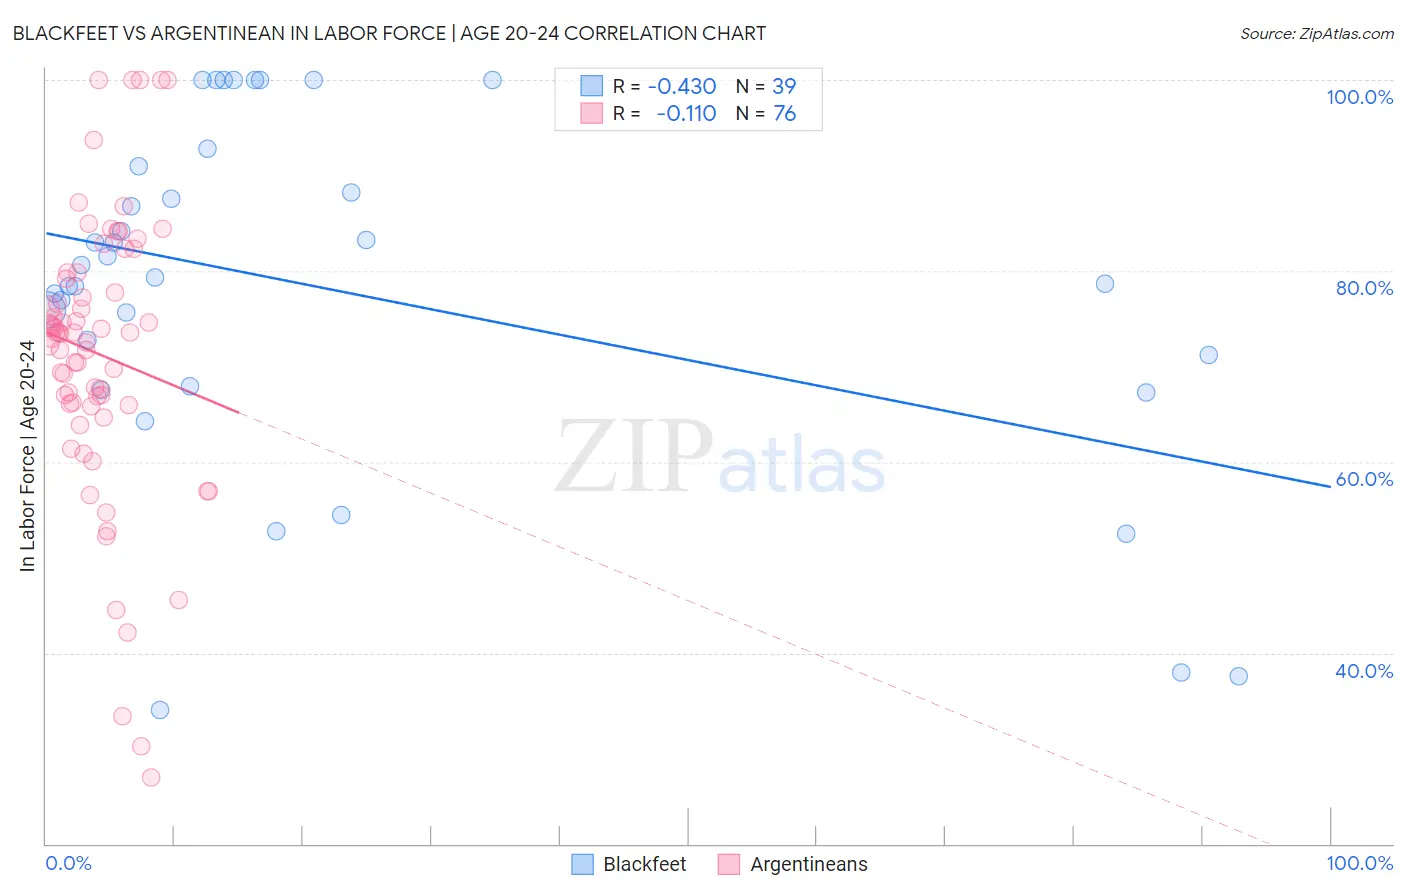
Blackfeet vs Argentinean In Labor Force | Age 20-24 Correlation Chart
The statistical analysis conducted on geographies consisting of 309,446,829 people shows a moderate negative correlation between the proportion of Blackfeet and labor force participation rate among population between the ages 20 and 24 in the United States with a correlation coefficient (R) of -0.430 and weighted average of 75.5%. Similarly, the statistical analysis conducted on geographies consisting of 297,088,097 people shows a poor negative correlation between the proportion of Argentineans and labor force participation rate among population between the ages 20 and 24 in the United States with a correlation coefficient (R) of -0.110 and weighted average of 73.1%, a difference of 3.3%.
In Labor Force | Age 20-24 Correlation Summary
| Measurement | Blackfeet | Argentinean |
| Minimum | 34.0% | 26.9% |
| Maximum | 100.0% | 100.0% |
| Range | 66.0% | 73.1% |
| Mean | 78.0% | 71.3% |
| Median | 79.4% | 73.5% |
| Interquartile 25% (IQ1) | 67.9% | 66.1% |
| Interquartile 75% (IQ3) | 91.0% | 79.5% |
| Interquartile Range (IQR) | 23.1% | 13.4% |
| Standard Deviation (Sample) | 18.0% | 14.9% |
| Standard Deviation (Population) | 17.8% | 14.8% |
Similar Demographics by In Labor Force | Age 20-24
Demographics Similar to Blackfeet by In Labor Force | Age 20-24
In terms of in labor force | age 20-24, the demographic groups most similar to Blackfeet are Romanian (75.5%, a difference of 0.010%), Immigrants from Brazil (75.5%, a difference of 0.030%), Jordanian (75.5%, a difference of 0.030%), Australian (75.5%, a difference of 0.030%), and Immigrants from England (75.5%, a difference of 0.030%).
| Demographics | Rating | Rank | In Labor Force | Age 20-24 |
| Yaqui | 85.5 /100 | #135 | Excellent 75.5% |
| Immigrants | Brazil | 84.8 /100 | #136 | Excellent 75.5% |
| Jordanians | 84.8 /100 | #137 | Excellent 75.5% |
| Australians | 84.8 /100 | #138 | Excellent 75.5% |
| Immigrants | England | 84.6 /100 | #139 | Excellent 75.5% |
| Delaware | 84.5 /100 | #140 | Excellent 75.5% |
| Romanians | 84.1 /100 | #141 | Excellent 75.5% |
| Blackfeet | 83.6 /100 | #142 | Excellent 75.5% |
| Spaniards | 82.0 /100 | #143 | Excellent 75.5% |
| Bhutanese | 80.8 /100 | #144 | Excellent 75.4% |
| Koreans | 79.7 /100 | #145 | Good 75.4% |
| Mexican American Indians | 78.8 /100 | #146 | Good 75.4% |
| Comanche | 77.6 /100 | #147 | Good 75.4% |
| Immigrants | Cambodia | 76.7 /100 | #148 | Good 75.4% |
| Ugandans | 76.1 /100 | #149 | Good 75.4% |
Demographics Similar to Argentineans by In Labor Force | Age 20-24
In terms of in labor force | age 20-24, the demographic groups most similar to Argentineans are U.S. Virgin Islander (73.0%, a difference of 0.030%), Immigrants from Korea (73.1%, a difference of 0.080%), Immigrants from Lebanon (73.1%, a difference of 0.10%), Immigrants from Belarus (73.0%, a difference of 0.11%), and Nicaraguan (73.2%, a difference of 0.13%).
| Demographics | Rating | Rank | In Labor Force | Age 20-24 |
| Immigrants | Venezuela | 0.1 /100 | #281 | Tragic 73.2% |
| Immigrants | Spain | 0.1 /100 | #282 | Tragic 73.2% |
| Immigrants | Bahamas | 0.1 /100 | #283 | Tragic 73.2% |
| Kiowa | 0.1 /100 | #284 | Tragic 73.2% |
| Nicaraguans | 0.1 /100 | #285 | Tragic 73.2% |
| Immigrants | Lebanon | 0.1 /100 | #286 | Tragic 73.1% |
| Immigrants | Korea | 0.1 /100 | #287 | Tragic 73.1% |
| Argentineans | 0.1 /100 | #288 | Tragic 73.1% |
| U.S. Virgin Islanders | 0.1 /100 | #289 | Tragic 73.0% |
| Immigrants | Belarus | 0.1 /100 | #290 | Tragic 73.0% |
| Immigrants | Nicaragua | 0.0 /100 | #291 | Tragic 72.9% |
| Pueblo | 0.0 /100 | #292 | Tragic 72.9% |
| Immigrants | Belize | 0.0 /100 | #293 | Tragic 72.8% |
| Immigrants | Argentina | 0.0 /100 | #294 | Tragic 72.8% |
| Okinawans | 0.0 /100 | #295 | Tragic 72.7% |