Immigrants from Burma/Myanmar vs Argentinean In Labor Force | Age 20-24
COMPARE
Immigrants from Burma/Myanmar
Argentinean
In Labor Force | Age 20-24
In Labor Force | Age 20-24 Comparison
Immigrants from Burma/Myanmar
Argentineans
76.3%
IN LABOR FORCE | AGE 20-24
99.1/ 100
METRIC RATING
90th/ 347
METRIC RANK
73.1%
IN LABOR FORCE | AGE 20-24
0.1/ 100
METRIC RATING
288th/ 347
METRIC RANK
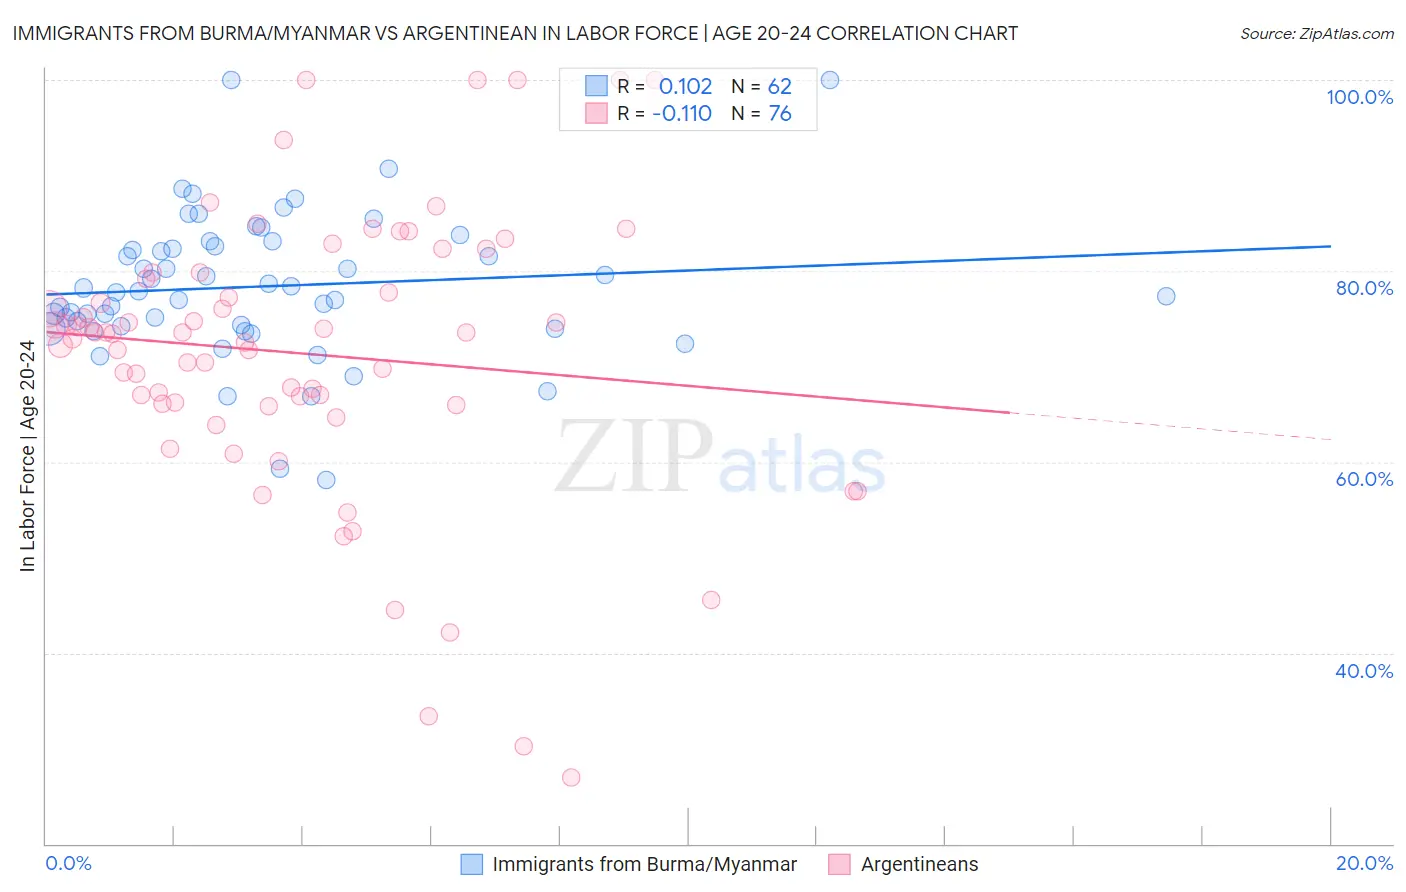
Immigrants from Burma/Myanmar vs Argentinean In Labor Force | Age 20-24 Correlation Chart
The statistical analysis conducted on geographies consisting of 172,353,766 people shows a poor positive correlation between the proportion of Immigrants from Burma/Myanmar and labor force participation rate among population between the ages 20 and 24 in the United States with a correlation coefficient (R) of 0.102 and weighted average of 76.3%. Similarly, the statistical analysis conducted on geographies consisting of 297,088,097 people shows a poor negative correlation between the proportion of Argentineans and labor force participation rate among population between the ages 20 and 24 in the United States with a correlation coefficient (R) of -0.110 and weighted average of 73.1%, a difference of 4.5%.
In Labor Force | Age 20-24 Correlation Summary
| Measurement | Immigrants from Burma/Myanmar | Argentinean |
| Minimum | 58.1% | 26.9% |
| Maximum | 100.0% | 100.0% |
| Range | 41.9% | 73.1% |
| Mean | 78.4% | 71.3% |
| Median | 77.8% | 73.5% |
| Interquartile 25% (IQ1) | 74.3% | 66.1% |
| Interquartile 75% (IQ3) | 82.6% | 79.5% |
| Interquartile Range (IQR) | 8.3% | 13.4% |
| Standard Deviation (Sample) | 7.6% | 14.9% |
| Standard Deviation (Population) | 7.5% | 14.8% |
Similar Demographics by In Labor Force | Age 20-24
Demographics Similar to Immigrants from Burma/Myanmar by In Labor Force | Age 20-24
In terms of in labor force | age 20-24, the demographic groups most similar to Immigrants from Burma/Myanmar are Sierra Leonean (76.3%, a difference of 0.020%), Spanish (76.4%, a difference of 0.050%), Bulgarian (76.4%, a difference of 0.050%), Maltese (76.3%, a difference of 0.050%), and Hungarian (76.3%, a difference of 0.070%).
| Demographics | Rating | Rank | In Labor Force | Age 20-24 |
| Carpatho Rusyns | 99.4 /100 | #83 | Exceptional 76.5% |
| Austrians | 99.4 /100 | #84 | Exceptional 76.5% |
| Portuguese | 99.3 /100 | #85 | Exceptional 76.4% |
| Immigrants | Iraq | 99.3 /100 | #86 | Exceptional 76.4% |
| Immigrants | Thailand | 99.3 /100 | #87 | Exceptional 76.4% |
| Spanish | 99.2 /100 | #88 | Exceptional 76.4% |
| Bulgarians | 99.2 /100 | #89 | Exceptional 76.4% |
| Immigrants | Burma/Myanmar | 99.1 /100 | #90 | Exceptional 76.3% |
| Sierra Leoneans | 99.0 /100 | #91 | Exceptional 76.3% |
| Maltese | 98.9 /100 | #92 | Exceptional 76.3% |
| Hungarians | 98.9 /100 | #93 | Exceptional 76.3% |
| Potawatomi | 98.5 /100 | #94 | Exceptional 76.2% |
| Immigrants | Germany | 98.5 /100 | #95 | Exceptional 76.2% |
| Immigrants | Nonimmigrants | 98.5 /100 | #96 | Exceptional 76.2% |
| Immigrants | Lithuania | 98.0 /100 | #97 | Exceptional 76.1% |
Demographics Similar to Argentineans by In Labor Force | Age 20-24
In terms of in labor force | age 20-24, the demographic groups most similar to Argentineans are U.S. Virgin Islander (73.0%, a difference of 0.030%), Immigrants from Korea (73.1%, a difference of 0.080%), Immigrants from Lebanon (73.1%, a difference of 0.10%), Immigrants from Belarus (73.0%, a difference of 0.11%), and Nicaraguan (73.2%, a difference of 0.13%).
| Demographics | Rating | Rank | In Labor Force | Age 20-24 |
| Immigrants | Venezuela | 0.1 /100 | #281 | Tragic 73.2% |
| Immigrants | Spain | 0.1 /100 | #282 | Tragic 73.2% |
| Immigrants | Bahamas | 0.1 /100 | #283 | Tragic 73.2% |
| Kiowa | 0.1 /100 | #284 | Tragic 73.2% |
| Nicaraguans | 0.1 /100 | #285 | Tragic 73.2% |
| Immigrants | Lebanon | 0.1 /100 | #286 | Tragic 73.1% |
| Immigrants | Korea | 0.1 /100 | #287 | Tragic 73.1% |
| Argentineans | 0.1 /100 | #288 | Tragic 73.1% |
| U.S. Virgin Islanders | 0.1 /100 | #289 | Tragic 73.0% |
| Immigrants | Belarus | 0.1 /100 | #290 | Tragic 73.0% |
| Immigrants | Nicaragua | 0.0 /100 | #291 | Tragic 72.9% |
| Pueblo | 0.0 /100 | #292 | Tragic 72.9% |
| Immigrants | Belize | 0.0 /100 | #293 | Tragic 72.8% |
| Immigrants | Argentina | 0.0 /100 | #294 | Tragic 72.8% |
| Okinawans | 0.0 /100 | #295 | Tragic 72.7% |