Chickasaw vs Argentinean In Labor Force | Age 20-24
COMPARE
Chickasaw
Argentinean
In Labor Force | Age 20-24
In Labor Force | Age 20-24 Comparison
Chickasaw
Argentineans
74.5%
IN LABOR FORCE | AGE 20-24
10.3/ 100
METRIC RATING
221st/ 347
METRIC RANK
73.1%
IN LABOR FORCE | AGE 20-24
0.1/ 100
METRIC RATING
288th/ 347
METRIC RANK
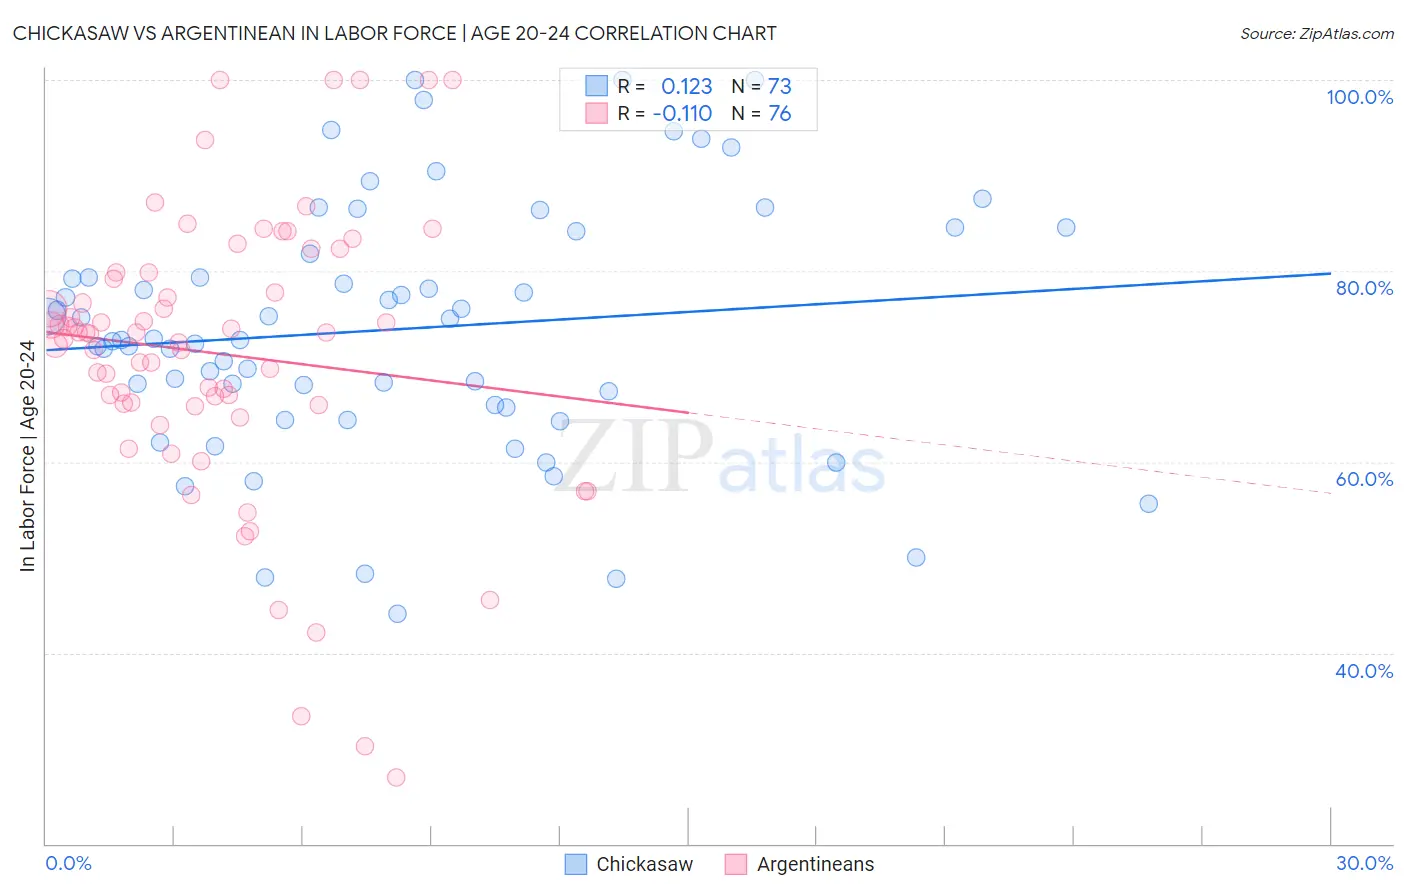
Chickasaw vs Argentinean In Labor Force | Age 20-24 Correlation Chart
The statistical analysis conducted on geographies consisting of 147,683,013 people shows a poor positive correlation between the proportion of Chickasaw and labor force participation rate among population between the ages 20 and 24 in the United States with a correlation coefficient (R) of 0.123 and weighted average of 74.5%. Similarly, the statistical analysis conducted on geographies consisting of 297,088,097 people shows a poor negative correlation between the proportion of Argentineans and labor force participation rate among population between the ages 20 and 24 in the United States with a correlation coefficient (R) of -0.110 and weighted average of 73.1%, a difference of 1.9%.
In Labor Force | Age 20-24 Correlation Summary
| Measurement | Chickasaw | Argentinean |
| Minimum | 44.1% | 26.9% |
| Maximum | 100.0% | 100.0% |
| Range | 55.9% | 73.1% |
| Mean | 73.9% | 71.3% |
| Median | 72.8% | 73.5% |
| Interquartile 25% (IQ1) | 65.8% | 66.1% |
| Interquartile 75% (IQ3) | 83.0% | 79.5% |
| Interquartile Range (IQR) | 17.2% | 13.4% |
| Standard Deviation (Sample) | 13.1% | 14.9% |
| Standard Deviation (Population) | 13.0% | 14.8% |
Similar Demographics by In Labor Force | Age 20-24
Demographics Similar to Chickasaw by In Labor Force | Age 20-24
In terms of in labor force | age 20-24, the demographic groups most similar to Chickasaw are Immigrants from Norway (74.5%, a difference of 0.0%), Immigrants from Peru (74.5%, a difference of 0.010%), Nepalese (74.5%, a difference of 0.010%), Immigrants from India (74.4%, a difference of 0.020%), and Chilean (74.5%, a difference of 0.080%).
| Demographics | Rating | Rank | In Labor Force | Age 20-24 |
| Immigrants | Southern Europe | 13.2 /100 | #214 | Poor 74.5% |
| Immigrants | Ghana | 12.7 /100 | #215 | Poor 74.5% |
| Immigrants | Kuwait | 12.7 /100 | #216 | Poor 74.5% |
| Chileans | 12.5 /100 | #217 | Poor 74.5% |
| Immigrants | Peru | 10.6 /100 | #218 | Poor 74.5% |
| Nepalese | 10.5 /100 | #219 | Poor 74.5% |
| Immigrants | Norway | 10.3 /100 | #220 | Poor 74.5% |
| Chickasaw | 10.3 /100 | #221 | Poor 74.5% |
| Immigrants | India | 9.9 /100 | #222 | Tragic 74.4% |
| Hispanics or Latinos | 7.9 /100 | #223 | Tragic 74.4% |
| Seminole | 6.9 /100 | #224 | Tragic 74.3% |
| Ghanaians | 6.2 /100 | #225 | Tragic 74.3% |
| Immigrants | Fiji | 5.9 /100 | #226 | Tragic 74.3% |
| Immigrants | Ireland | 5.8 /100 | #227 | Tragic 74.3% |
| Immigrants | Ukraine | 5.1 /100 | #228 | Tragic 74.2% |
Demographics Similar to Argentineans by In Labor Force | Age 20-24
In terms of in labor force | age 20-24, the demographic groups most similar to Argentineans are U.S. Virgin Islander (73.0%, a difference of 0.030%), Immigrants from Korea (73.1%, a difference of 0.080%), Immigrants from Lebanon (73.1%, a difference of 0.10%), Immigrants from Belarus (73.0%, a difference of 0.11%), and Nicaraguan (73.2%, a difference of 0.13%).
| Demographics | Rating | Rank | In Labor Force | Age 20-24 |
| Immigrants | Venezuela | 0.1 /100 | #281 | Tragic 73.2% |
| Immigrants | Spain | 0.1 /100 | #282 | Tragic 73.2% |
| Immigrants | Bahamas | 0.1 /100 | #283 | Tragic 73.2% |
| Kiowa | 0.1 /100 | #284 | Tragic 73.2% |
| Nicaraguans | 0.1 /100 | #285 | Tragic 73.2% |
| Immigrants | Lebanon | 0.1 /100 | #286 | Tragic 73.1% |
| Immigrants | Korea | 0.1 /100 | #287 | Tragic 73.1% |
| Argentineans | 0.1 /100 | #288 | Tragic 73.1% |
| U.S. Virgin Islanders | 0.1 /100 | #289 | Tragic 73.0% |
| Immigrants | Belarus | 0.1 /100 | #290 | Tragic 73.0% |
| Immigrants | Nicaragua | 0.0 /100 | #291 | Tragic 72.9% |
| Pueblo | 0.0 /100 | #292 | Tragic 72.9% |
| Immigrants | Belize | 0.0 /100 | #293 | Tragic 72.8% |
| Immigrants | Argentina | 0.0 /100 | #294 | Tragic 72.8% |
| Okinawans | 0.0 /100 | #295 | Tragic 72.7% |