Potawatomi vs Argentinean In Labor Force | Age 20-24
COMPARE
Potawatomi
Argentinean
In Labor Force | Age 20-24
In Labor Force | Age 20-24 Comparison
Potawatomi
Argentineans
76.2%
IN LABOR FORCE | AGE 20-24
98.5/ 100
METRIC RATING
94th/ 347
METRIC RANK
73.1%
IN LABOR FORCE | AGE 20-24
0.1/ 100
METRIC RATING
288th/ 347
METRIC RANK
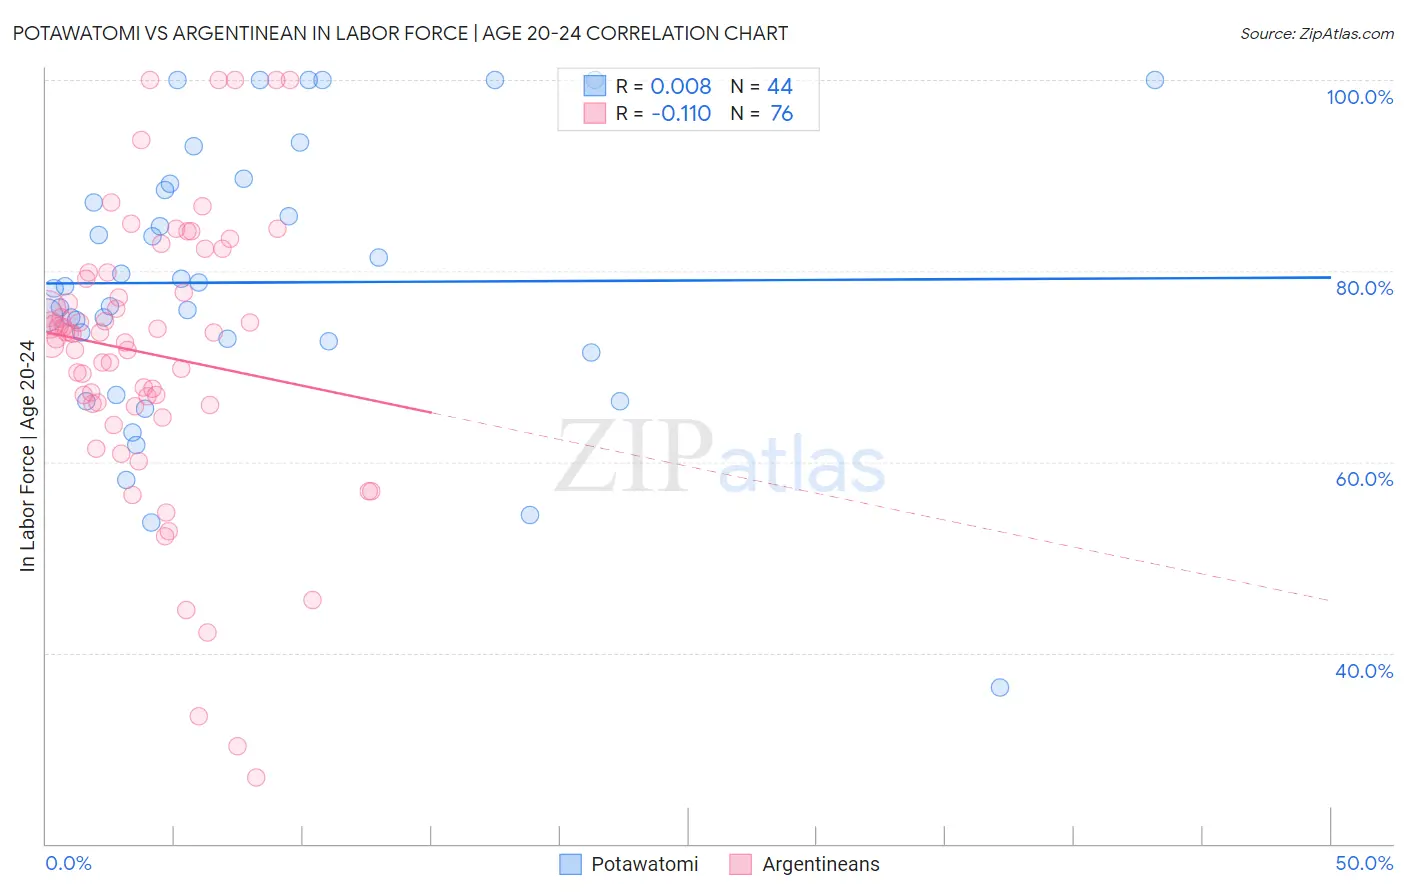
Potawatomi vs Argentinean In Labor Force | Age 20-24 Correlation Chart
The statistical analysis conducted on geographies consisting of 117,717,222 people shows no correlation between the proportion of Potawatomi and labor force participation rate among population between the ages 20 and 24 in the United States with a correlation coefficient (R) of 0.008 and weighted average of 76.2%. Similarly, the statistical analysis conducted on geographies consisting of 297,088,097 people shows a poor negative correlation between the proportion of Argentineans and labor force participation rate among population between the ages 20 and 24 in the United States with a correlation coefficient (R) of -0.110 and weighted average of 73.1%, a difference of 4.3%.
In Labor Force | Age 20-24 Correlation Summary
| Measurement | Potawatomi | Argentinean |
| Minimum | 36.4% | 26.9% |
| Maximum | 100.0% | 100.0% |
| Range | 63.6% | 73.1% |
| Mean | 78.8% | 71.3% |
| Median | 78.3% | 73.5% |
| Interquartile 25% (IQ1) | 72.0% | 66.1% |
| Interquartile 75% (IQ3) | 88.8% | 79.5% |
| Interquartile Range (IQR) | 16.7% | 13.4% |
| Standard Deviation (Sample) | 14.4% | 14.9% |
| Standard Deviation (Population) | 14.2% | 14.8% |
Similar Demographics by In Labor Force | Age 20-24
Demographics Similar to Potawatomi by In Labor Force | Age 20-24
In terms of in labor force | age 20-24, the demographic groups most similar to Potawatomi are Immigrants from Germany (76.2%, a difference of 0.0%), Nonimmigrants (76.2%, a difference of 0.010%), Hungarian (76.3%, a difference of 0.090%), Maltese (76.3%, a difference of 0.11%), and Immigrants from Lithuania (76.1%, a difference of 0.12%).
| Demographics | Rating | Rank | In Labor Force | Age 20-24 |
| Immigrants | Thailand | 99.3 /100 | #87 | Exceptional 76.4% |
| Spanish | 99.2 /100 | #88 | Exceptional 76.4% |
| Bulgarians | 99.2 /100 | #89 | Exceptional 76.4% |
| Immigrants | Burma/Myanmar | 99.1 /100 | #90 | Exceptional 76.3% |
| Sierra Leoneans | 99.0 /100 | #91 | Exceptional 76.3% |
| Maltese | 98.9 /100 | #92 | Exceptional 76.3% |
| Hungarians | 98.9 /100 | #93 | Exceptional 76.3% |
| Potawatomi | 98.5 /100 | #94 | Exceptional 76.2% |
| Immigrants | Germany | 98.5 /100 | #95 | Exceptional 76.2% |
| Immigrants | Nonimmigrants | 98.5 /100 | #96 | Exceptional 76.2% |
| Immigrants | Lithuania | 98.0 /100 | #97 | Exceptional 76.1% |
| Immigrants | Oceania | 98.0 /100 | #98 | Exceptional 76.1% |
| Americans | 97.8 /100 | #99 | Exceptional 76.1% |
| Shoshone | 97.8 /100 | #100 | Exceptional 76.1% |
| Immigrants | Poland | 97.7 /100 | #101 | Exceptional 76.1% |
Demographics Similar to Argentineans by In Labor Force | Age 20-24
In terms of in labor force | age 20-24, the demographic groups most similar to Argentineans are U.S. Virgin Islander (73.0%, a difference of 0.030%), Immigrants from Korea (73.1%, a difference of 0.080%), Immigrants from Lebanon (73.1%, a difference of 0.10%), Immigrants from Belarus (73.0%, a difference of 0.11%), and Nicaraguan (73.2%, a difference of 0.13%).
| Demographics | Rating | Rank | In Labor Force | Age 20-24 |
| Immigrants | Venezuela | 0.1 /100 | #281 | Tragic 73.2% |
| Immigrants | Spain | 0.1 /100 | #282 | Tragic 73.2% |
| Immigrants | Bahamas | 0.1 /100 | #283 | Tragic 73.2% |
| Kiowa | 0.1 /100 | #284 | Tragic 73.2% |
| Nicaraguans | 0.1 /100 | #285 | Tragic 73.2% |
| Immigrants | Lebanon | 0.1 /100 | #286 | Tragic 73.1% |
| Immigrants | Korea | 0.1 /100 | #287 | Tragic 73.1% |
| Argentineans | 0.1 /100 | #288 | Tragic 73.1% |
| U.S. Virgin Islanders | 0.1 /100 | #289 | Tragic 73.0% |
| Immigrants | Belarus | 0.1 /100 | #290 | Tragic 73.0% |
| Immigrants | Nicaragua | 0.0 /100 | #291 | Tragic 72.9% |
| Pueblo | 0.0 /100 | #292 | Tragic 72.9% |
| Immigrants | Belize | 0.0 /100 | #293 | Tragic 72.8% |
| Immigrants | Argentina | 0.0 /100 | #294 | Tragic 72.8% |
| Okinawans | 0.0 /100 | #295 | Tragic 72.7% |