Immigrants from Liberia vs Immigrants from Morocco In Labor Force | Age 20-24
COMPARE
Immigrants from Liberia
Immigrants from Morocco
In Labor Force | Age 20-24
In Labor Force | Age 20-24 Comparison
Immigrants from Liberia
Immigrants from Morocco
77.1%
IN LABOR FORCE | AGE 20-24
99.9/ 100
METRIC RATING
55th/ 347
METRIC RANK
75.9%
IN LABOR FORCE | AGE 20-24
95.8/ 100
METRIC RATING
110th/ 347
METRIC RANK
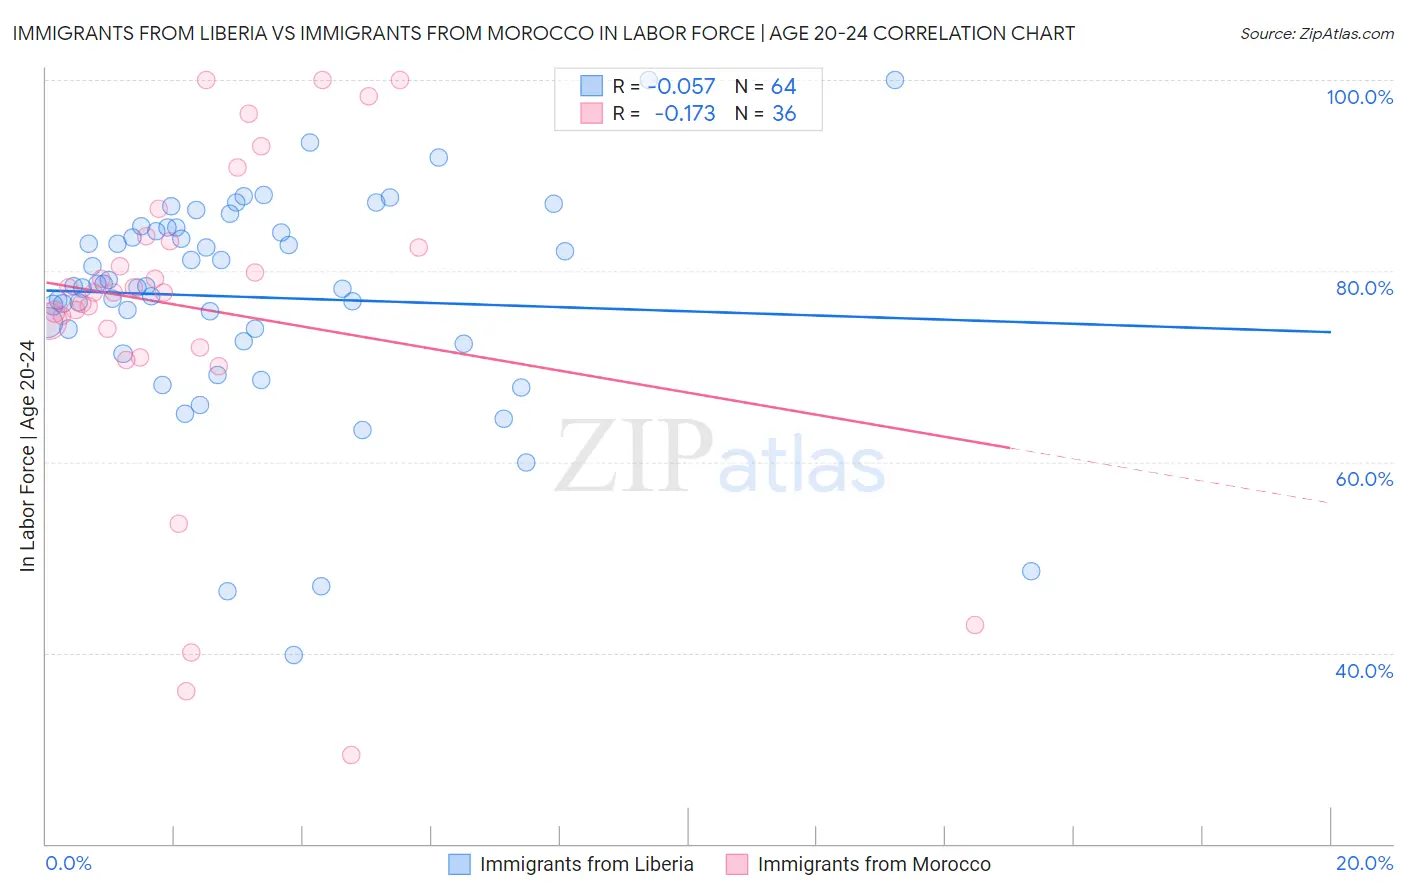
Immigrants from Liberia vs Immigrants from Morocco In Labor Force | Age 20-24 Correlation Chart
The statistical analysis conducted on geographies consisting of 135,280,504 people shows a slight negative correlation between the proportion of Immigrants from Liberia and labor force participation rate among population between the ages 20 and 24 in the United States with a correlation coefficient (R) of -0.057 and weighted average of 77.1%. Similarly, the statistical analysis conducted on geographies consisting of 178,862,566 people shows a poor negative correlation between the proportion of Immigrants from Morocco and labor force participation rate among population between the ages 20 and 24 in the United States with a correlation coefficient (R) of -0.173 and weighted average of 75.9%, a difference of 1.5%.
In Labor Force | Age 20-24 Correlation Summary
| Measurement | Immigrants from Liberia | Immigrants from Morocco |
| Minimum | 39.8% | 29.3% |
| Maximum | 100.0% | 100.0% |
| Range | 60.2% | 70.7% |
| Mean | 77.3% | 76.0% |
| Median | 78.4% | 77.8% |
| Interquartile 25% (IQ1) | 73.3% | 72.9% |
| Interquartile 75% (IQ3) | 84.3% | 83.4% |
| Interquartile Range (IQR) | 11.1% | 10.5% |
| Standard Deviation (Sample) | 11.5% | 17.1% |
| Standard Deviation (Population) | 11.4% | 16.9% |
Similar Demographics by In Labor Force | Age 20-24
Demographics Similar to Immigrants from Liberia by In Labor Force | Age 20-24
In terms of in labor force | age 20-24, the demographic groups most similar to Immigrants from Liberia are European (77.1%, a difference of 0.010%), Celtic (77.1%, a difference of 0.020%), Chippewa (77.1%, a difference of 0.020%), Hawaiian (77.0%, a difference of 0.040%), and Scotch-Irish (77.0%, a difference of 0.070%).
| Demographics | Rating | Rank | In Labor Force | Age 20-24 |
| Serbians | 100.0 /100 | #48 | Exceptional 77.3% |
| Chinese | 100.0 /100 | #49 | Exceptional 77.3% |
| Malaysians | 100.0 /100 | #50 | Exceptional 77.2% |
| Croatians | 100.0 /100 | #51 | Exceptional 77.2% |
| Indonesians | 100.0 /100 | #52 | Exceptional 77.2% |
| Immigrants | Azores | 100.0 /100 | #53 | Exceptional 77.2% |
| Celtics | 99.9 /100 | #54 | Exceptional 77.1% |
| Immigrants | Liberia | 99.9 /100 | #55 | Exceptional 77.1% |
| Europeans | 99.9 /100 | #56 | Exceptional 77.1% |
| Chippewa | 99.9 /100 | #57 | Exceptional 77.1% |
| Hawaiians | 99.9 /100 | #58 | Exceptional 77.0% |
| Scotch-Irish | 99.9 /100 | #59 | Exceptional 77.0% |
| Kenyans | 99.9 /100 | #60 | Exceptional 77.0% |
| Immigrants | Eritrea | 99.9 /100 | #61 | Exceptional 77.0% |
| Immigrants | Kenya | 99.9 /100 | #62 | Exceptional 77.0% |
Demographics Similar to Immigrants from Morocco by In Labor Force | Age 20-24
In terms of in labor force | age 20-24, the demographic groups most similar to Immigrants from Morocco are Cherokee (75.9%, a difference of 0.0%), Ukrainian (75.9%, a difference of 0.010%), Immigrants from Canada (75.9%, a difference of 0.020%), Immigrants from Netherlands (75.9%, a difference of 0.050%), and Immigrants from Zimbabwe (75.9%, a difference of 0.060%).
| Demographics | Rating | Rank | In Labor Force | Age 20-24 |
| Immigrants | North Macedonia | 97.5 /100 | #103 | Exceptional 76.1% |
| Macedonians | 97.2 /100 | #104 | Exceptional 76.0% |
| Immigrants | Nepal | 97.2 /100 | #105 | Exceptional 76.0% |
| Immigrants | Uganda | 97.1 /100 | #106 | Exceptional 76.0% |
| Greeks | 96.9 /100 | #107 | Exceptional 76.0% |
| Iraqis | 96.6 /100 | #108 | Exceptional 76.0% |
| Cherokee | 95.8 /100 | #109 | Exceptional 75.9% |
| Immigrants | Morocco | 95.8 /100 | #110 | Exceptional 75.9% |
| Ukrainians | 95.7 /100 | #111 | Exceptional 75.9% |
| Immigrants | Canada | 95.6 /100 | #112 | Exceptional 75.9% |
| Immigrants | Netherlands | 95.3 /100 | #113 | Exceptional 75.9% |
| Immigrants | Zimbabwe | 95.1 /100 | #114 | Exceptional 75.9% |
| Alaska Natives | 95.1 /100 | #115 | Exceptional 75.9% |
| Immigrants | North America | 95.0 /100 | #116 | Exceptional 75.9% |
| Assyrians/Chaldeans/Syriacs | 94.9 /100 | #117 | Exceptional 75.9% |