Australian vs Somali In Labor Force | Age 25-29
COMPARE
Australian
Somali
In Labor Force | Age 25-29
In Labor Force | Age 25-29 Comparison
Australians
Somalis
84.9%
IN LABOR FORCE | AGE 25-29
83.6/ 100
METRIC RATING
128th/ 347
METRIC RANK
87.1%
IN LABOR FORCE | AGE 25-29
100.0/ 100
METRIC RATING
3rd/ 347
METRIC RANK
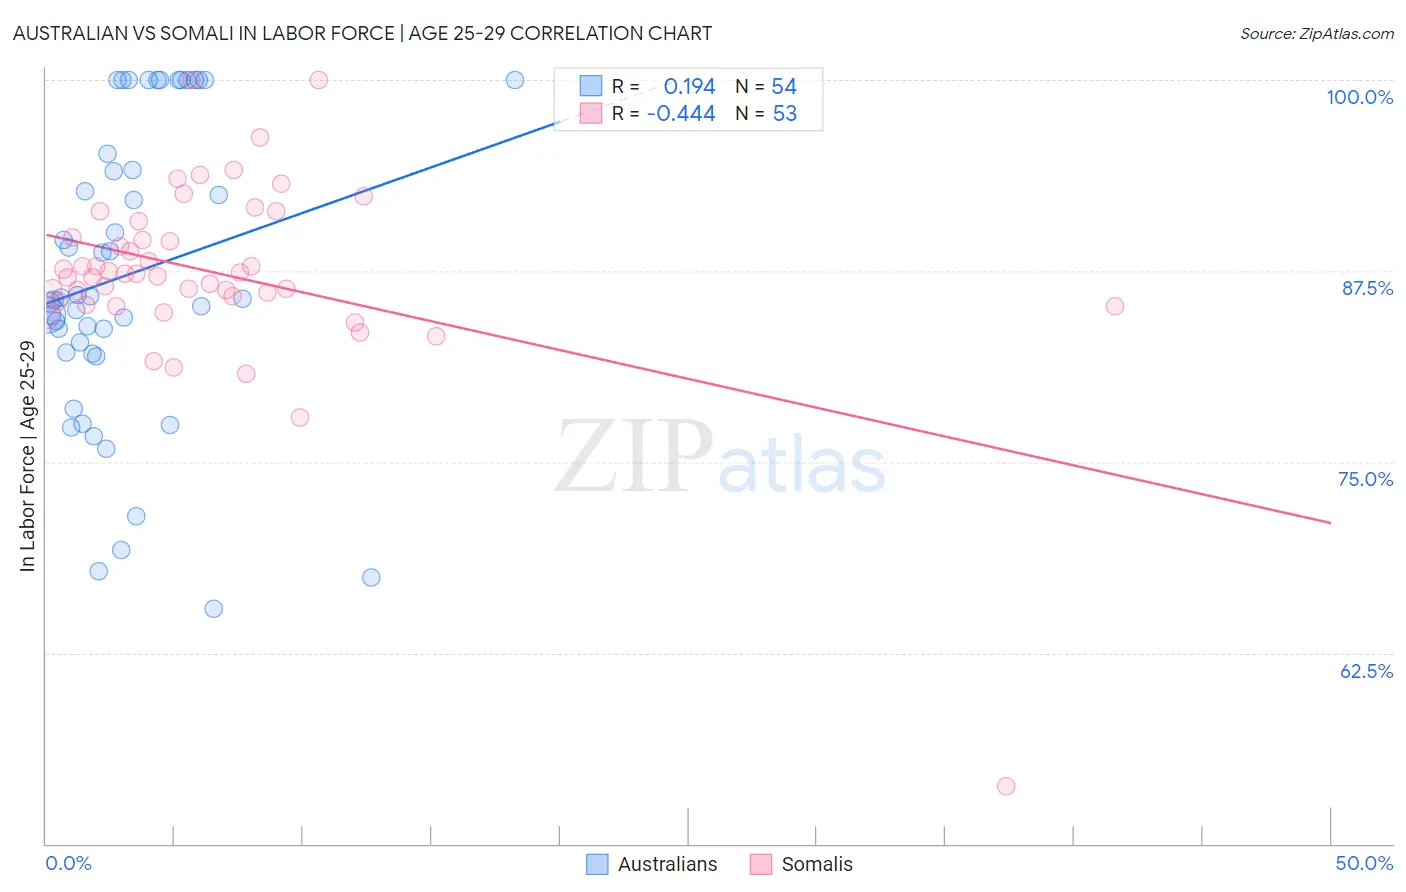
Australian vs Somali In Labor Force | Age 25-29 Correlation Chart
The statistical analysis conducted on geographies consisting of 224,101,072 people shows a poor positive correlation between the proportion of Australians and labor force participation rate among population between the ages 25 and 29 in the United States with a correlation coefficient (R) of 0.194 and weighted average of 84.9%. Similarly, the statistical analysis conducted on geographies consisting of 99,327,159 people shows a moderate negative correlation between the proportion of Somalis and labor force participation rate among population between the ages 25 and 29 in the United States with a correlation coefficient (R) of -0.444 and weighted average of 87.1%, a difference of 2.5%.
In Labor Force | Age 25-29 Correlation Summary
| Measurement | Australian | Somali |
| Minimum | 65.4% | 53.8% |
| Maximum | 100.0% | 100.0% |
| Range | 34.6% | 46.2% |
| Mean | 87.3% | 87.4% |
| Median | 85.7% | 87.3% |
| Interquartile 25% (IQ1) | 82.2% | 85.4% |
| Interquartile 75% (IQ3) | 95.2% | 90.2% |
| Interquartile Range (IQR) | 13.0% | 4.8% |
| Standard Deviation (Sample) | 9.7% | 6.4% |
| Standard Deviation (Population) | 9.6% | 6.3% |
Similar Demographics by In Labor Force | Age 25-29
Demographics Similar to Australians by In Labor Force | Age 25-29
In terms of in labor force | age 25-29, the demographic groups most similar to Australians are Uruguayan (84.9%, a difference of 0.010%), Immigrants from Singapore (84.9%, a difference of 0.010%), Immigrants from Uruguay (84.9%, a difference of 0.010%), Scandinavian (84.9%, a difference of 0.020%), and Dutch (84.9%, a difference of 0.020%).
| Demographics | Rating | Rank | In Labor Force | Age 25-29 |
| Immigrants | Chile | 85.6 /100 | #121 | Excellent 84.9% |
| Scandinavians | 85.1 /100 | #122 | Excellent 84.9% |
| Dutch | 84.9 /100 | #123 | Excellent 84.9% |
| Immigrants | Iran | 84.8 /100 | #124 | Excellent 84.9% |
| Uruguayans | 84.7 /100 | #125 | Excellent 84.9% |
| Immigrants | Singapore | 84.4 /100 | #126 | Excellent 84.9% |
| Immigrants | Uruguay | 84.0 /100 | #127 | Excellent 84.9% |
| Australians | 83.6 /100 | #128 | Excellent 84.9% |
| Immigrants | Russia | 81.6 /100 | #129 | Excellent 84.9% |
| Northern Europeans | 81.3 /100 | #130 | Excellent 84.9% |
| Iranians | 78.1 /100 | #131 | Good 84.8% |
| Romanians | 77.7 /100 | #132 | Good 84.8% |
| Asians | 77.7 /100 | #133 | Good 84.8% |
| Syrians | 76.5 /100 | #134 | Good 84.8% |
| Immigrants | Hungary | 76.4 /100 | #135 | Good 84.8% |
Demographics Similar to Somalis by In Labor Force | Age 25-29
In terms of in labor force | age 25-29, the demographic groups most similar to Somalis are Immigrants from Somalia (87.1%, a difference of 0.010%), Carpatho Rusyn (87.0%, a difference of 0.090%), Luxembourger (86.9%, a difference of 0.19%), Slovene (86.4%, a difference of 0.80%), and Immigrants from Bosnia and Herzegovina (86.3%, a difference of 0.93%).
| Demographics | Rating | Rank | In Labor Force | Age 25-29 |
| Tsimshian | 100.0 /100 | #1 | Exceptional 88.7% |
| Immigrants | Somalia | 100.0 /100 | #2 | Exceptional 87.1% |
| Somalis | 100.0 /100 | #3 | Exceptional 87.1% |
| Carpatho Rusyns | 100.0 /100 | #4 | Exceptional 87.0% |
| Luxembourgers | 100.0 /100 | #5 | Exceptional 86.9% |
| Slovenes | 100.0 /100 | #6 | Exceptional 86.4% |
| Immigrants | Bosnia and Herzegovina | 100.0 /100 | #7 | Exceptional 86.3% |
| Immigrants | Cabo Verde | 100.0 /100 | #8 | Exceptional 86.2% |
| Ethiopians | 100.0 /100 | #9 | Exceptional 86.2% |
| Liberians | 100.0 /100 | #10 | Exceptional 86.1% |
| Immigrants | Ethiopia | 100.0 /100 | #11 | Exceptional 86.1% |
| Immigrants | Lithuania | 100.0 /100 | #12 | Exceptional 86.1% |
| Norwegians | 100.0 /100 | #13 | Exceptional 86.1% |
| Latvians | 100.0 /100 | #14 | Exceptional 86.1% |
| Bolivians | 100.0 /100 | #15 | Exceptional 86.1% |