Immigrants from Lebanon vs Somali Householder Income Ages 45 - 64 years
COMPARE
Immigrants from Lebanon
Somali
Householder Income Ages 45 - 64 years
Householder Income Ages 45 - 64 years Comparison
Immigrants from Lebanon
Somalis
$108,471
HOUSEHOLDER INCOME AGES 45 - 64 YEARS
98.3/ 100
METRIC RATING
91st/ 347
METRIC RANK
$88,600
HOUSEHOLDER INCOME AGES 45 - 64 YEARS
0.3/ 100
METRIC RATING
262nd/ 347
METRIC RANK
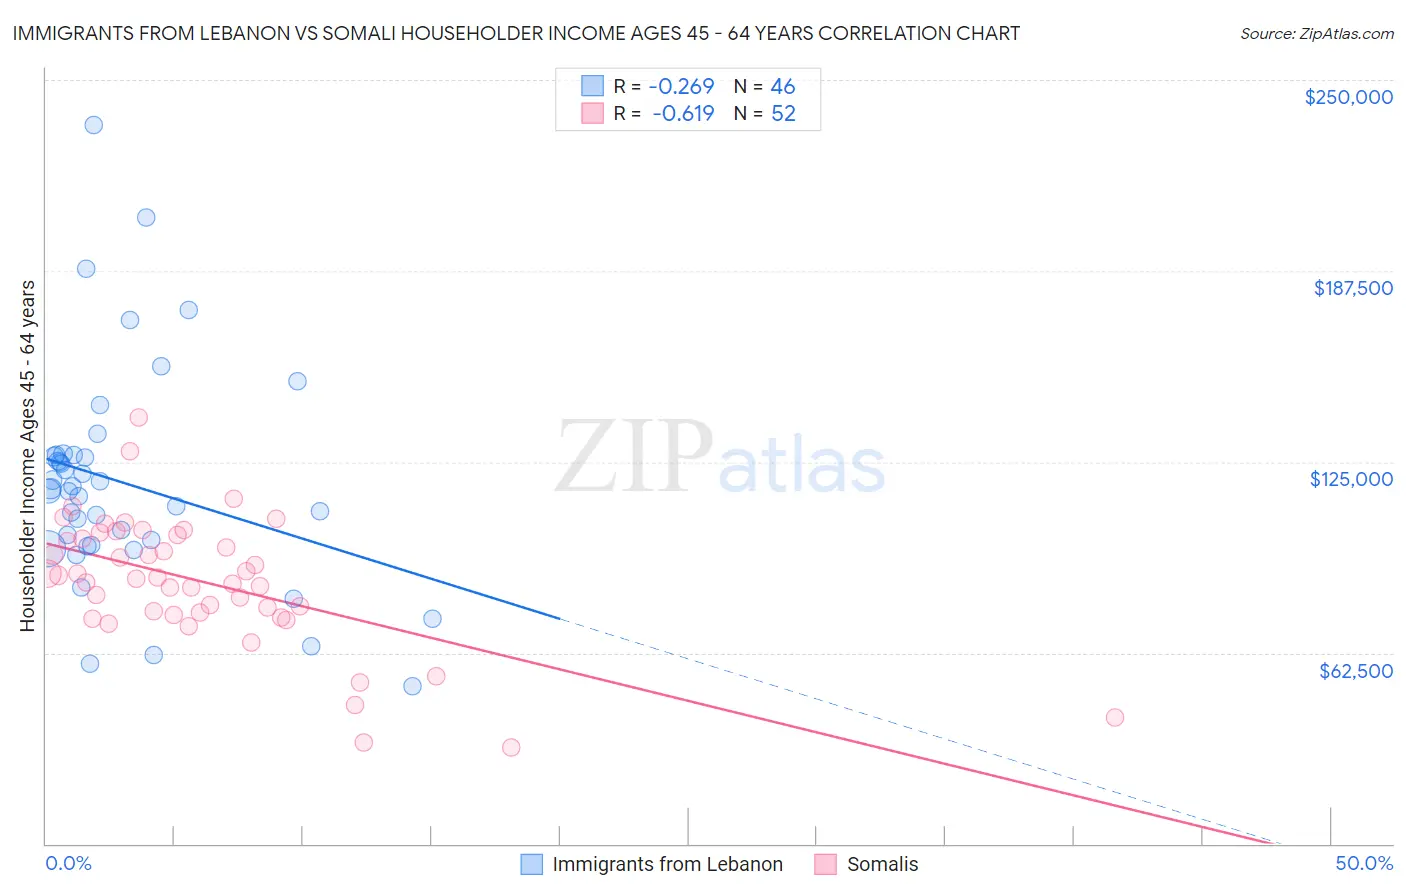
Immigrants from Lebanon vs Somali Householder Income Ages 45 - 64 years Correlation Chart
The statistical analysis conducted on geographies consisting of 217,063,471 people shows a weak negative correlation between the proportion of Immigrants from Lebanon and household income with householder between the ages 45 and 64 in the United States with a correlation coefficient (R) of -0.269 and weighted average of $108,471. Similarly, the statistical analysis conducted on geographies consisting of 99,239,152 people shows a significant negative correlation between the proportion of Somalis and household income with householder between the ages 45 and 64 in the United States with a correlation coefficient (R) of -0.619 and weighted average of $88,600, a difference of 22.4%.
Householder Income Ages 45 - 64 years Correlation Summary
| Measurement | Immigrants from Lebanon | Somali |
| Minimum | $51,559 | $31,458 |
| Maximum | $235,112 | $139,513 |
| Range | $183,553 | $108,055 |
| Mean | $118,072 | $85,624 |
| Median | $115,795 | $86,901 |
| Interquartile 25% (IQ1) | $97,661 | $75,206 |
| Interquartile 75% (IQ3) | $127,190 | $100,414 |
| Interquartile Range (IQR) | $29,528 | $25,208 |
| Standard Deviation (Sample) | $36,074 | $21,267 |
| Standard Deviation (Population) | $35,680 | $21,061 |
Similar Demographics by Householder Income Ages 45 - 64 years
Demographics Similar to Immigrants from Lebanon by Householder Income Ages 45 - 64 years
In terms of householder income ages 45 - 64 years, the demographic groups most similar to Immigrants from Lebanon are Ukrainian ($108,475, a difference of 0.0%), Immigrants from Philippines ($108,471, a difference of 0.0%), Croatian ($108,383, a difference of 0.080%), Romanian ($108,609, a difference of 0.13%), and Immigrants from Croatia ($108,304, a difference of 0.15%).
| Demographics | Rating | Rank | Householder Income Ages 45 - 64 years |
| Immigrants | Western Europe | 98.6 /100 | #84 | Exceptional $108,824 |
| Immigrants | Afghanistan | 98.6 /100 | #85 | Exceptional $108,785 |
| Austrians | 98.5 /100 | #86 | Exceptional $108,692 |
| Tongans | 98.5 /100 | #87 | Exceptional $108,643 |
| Romanians | 98.5 /100 | #88 | Exceptional $108,609 |
| Ukrainians | 98.3 /100 | #89 | Exceptional $108,475 |
| Immigrants | Philippines | 98.3 /100 | #90 | Exceptional $108,471 |
| Immigrants | Lebanon | 98.3 /100 | #91 | Exceptional $108,471 |
| Croatians | 98.3 /100 | #92 | Exceptional $108,383 |
| Immigrants | Croatia | 98.2 /100 | #93 | Exceptional $108,304 |
| Sri Lankans | 98.2 /100 | #94 | Exceptional $108,270 |
| Immigrants | Hungary | 98.2 /100 | #95 | Exceptional $108,267 |
| Immigrants | Argentina | 98.2 /100 | #96 | Exceptional $108,264 |
| Northern Europeans | 97.8 /100 | #97 | Exceptional $107,870 |
| Immigrants | Southern Europe | 97.7 /100 | #98 | Exceptional $107,775 |
Demographics Similar to Somalis by Householder Income Ages 45 - 64 years
In terms of householder income ages 45 - 64 years, the demographic groups most similar to Somalis are Belizean ($88,684, a difference of 0.090%), Immigrants from Senegal ($88,421, a difference of 0.20%), Osage ($88,390, a difference of 0.24%), Jamaican ($88,327, a difference of 0.31%), and Liberian ($88,929, a difference of 0.37%).
| Demographics | Rating | Rank | Householder Income Ages 45 - 64 years |
| West Indians | 0.5 /100 | #255 | Tragic $89,906 |
| French American Indians | 0.5 /100 | #256 | Tragic $89,811 |
| German Russians | 0.4 /100 | #257 | Tragic $89,398 |
| Immigrants | Barbados | 0.4 /100 | #258 | Tragic $89,394 |
| Immigrants | Nicaragua | 0.4 /100 | #259 | Tragic $89,108 |
| Liberians | 0.3 /100 | #260 | Tragic $88,929 |
| Belizeans | 0.3 /100 | #261 | Tragic $88,684 |
| Somalis | 0.3 /100 | #262 | Tragic $88,600 |
| Immigrants | Senegal | 0.3 /100 | #263 | Tragic $88,421 |
| Osage | 0.3 /100 | #264 | Tragic $88,390 |
| Jamaicans | 0.2 /100 | #265 | Tragic $88,327 |
| Immigrants | West Indies | 0.2 /100 | #266 | Tragic $88,164 |
| Hmong | 0.2 /100 | #267 | Tragic $88,115 |
| Immigrants | Micronesia | 0.2 /100 | #268 | Tragic $87,864 |
| Spanish Americans | 0.2 /100 | #269 | Tragic $87,836 |