Cherokee vs Somali In Labor Force | Age 25-29
COMPARE
Cherokee
Somali
In Labor Force | Age 25-29
In Labor Force | Age 25-29 Comparison
Cherokee
Somalis
82.1%
IN LABOR FORCE | AGE 25-29
0.0/ 100
METRIC RATING
314th/ 347
METRIC RANK
87.1%
IN LABOR FORCE | AGE 25-29
100.0/ 100
METRIC RATING
3rd/ 347
METRIC RANK
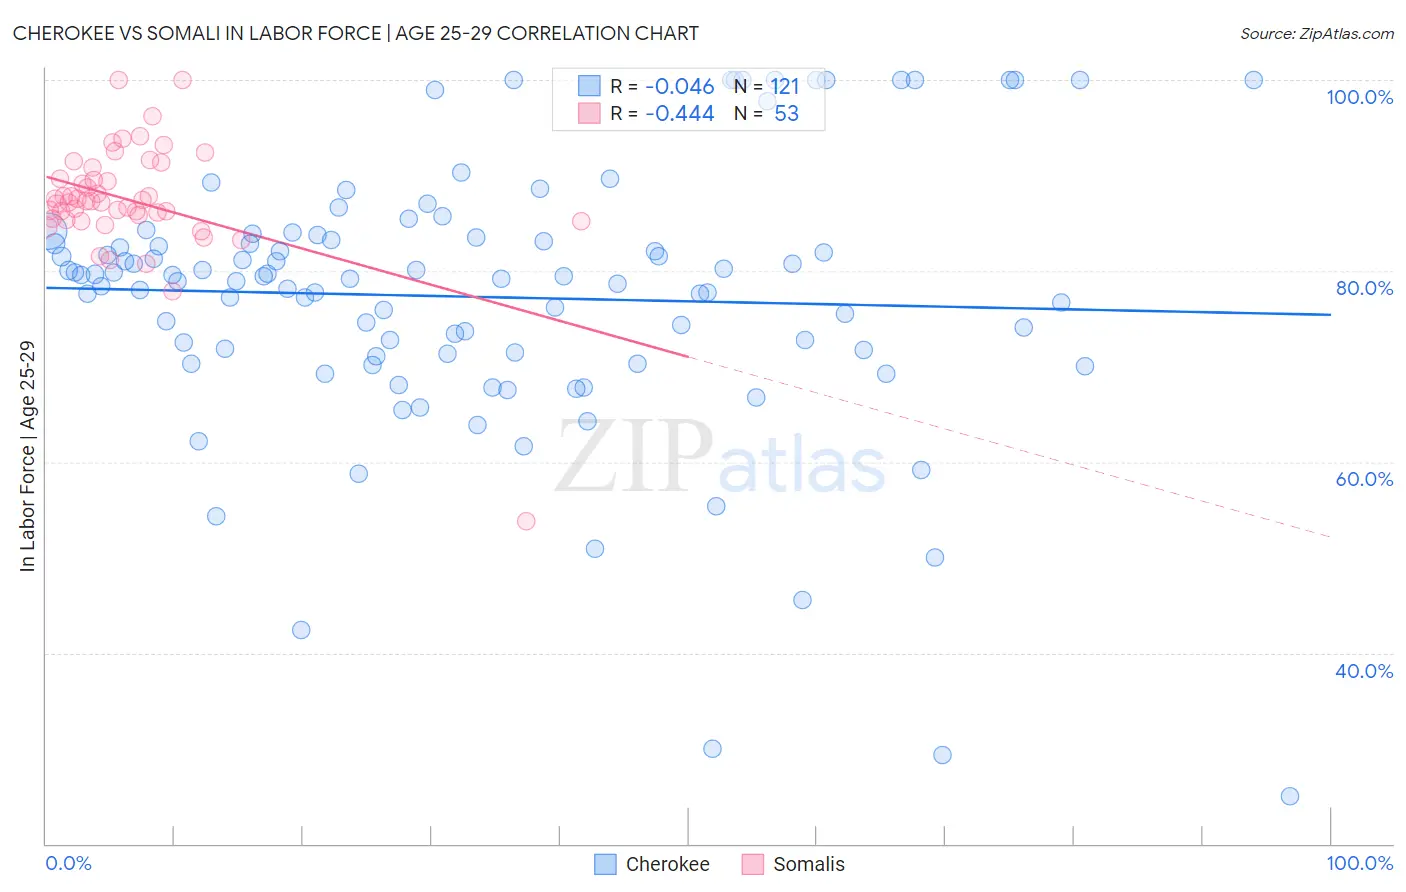
Cherokee vs Somali In Labor Force | Age 25-29 Correlation Chart
The statistical analysis conducted on geographies consisting of 493,231,210 people shows no correlation between the proportion of Cherokee and labor force participation rate among population between the ages 25 and 29 in the United States with a correlation coefficient (R) of -0.046 and weighted average of 82.1%. Similarly, the statistical analysis conducted on geographies consisting of 99,327,159 people shows a moderate negative correlation between the proportion of Somalis and labor force participation rate among population between the ages 25 and 29 in the United States with a correlation coefficient (R) of -0.444 and weighted average of 87.1%, a difference of 6.0%.
In Labor Force | Age 25-29 Correlation Summary
| Measurement | Cherokee | Somali |
| Minimum | 25.0% | 53.8% |
| Maximum | 100.0% | 100.0% |
| Range | 75.0% | 46.2% |
| Mean | 77.3% | 87.4% |
| Median | 79.1% | 87.3% |
| Interquartile 25% (IQ1) | 71.2% | 85.4% |
| Interquartile 75% (IQ3) | 83.4% | 90.2% |
| Interquartile Range (IQR) | 12.2% | 4.8% |
| Standard Deviation (Sample) | 14.2% | 6.4% |
| Standard Deviation (Population) | 14.2% | 6.3% |
Similar Demographics by In Labor Force | Age 25-29
Demographics Similar to Cherokee by In Labor Force | Age 25-29
In terms of in labor force | age 25-29, the demographic groups most similar to Cherokee are Yaqui (82.2%, a difference of 0.050%), Immigrants from Mexico (82.0%, a difference of 0.13%), Hispanic or Latino (82.2%, a difference of 0.14%), Alaskan Athabascan (82.3%, a difference of 0.21%), and Osage (82.3%, a difference of 0.22%).
| Demographics | Rating | Rank | In Labor Force | Age 25-29 |
| Cajuns | 0.0 /100 | #307 | Tragic 82.5% |
| Central American Indians | 0.0 /100 | #308 | Tragic 82.4% |
| Immigrants | Central America | 0.0 /100 | #309 | Tragic 82.4% |
| Osage | 0.0 /100 | #310 | Tragic 82.3% |
| Alaskan Athabascans | 0.0 /100 | #311 | Tragic 82.3% |
| Hispanics or Latinos | 0.0 /100 | #312 | Tragic 82.2% |
| Yaqui | 0.0 /100 | #313 | Tragic 82.2% |
| Cherokee | 0.0 /100 | #314 | Tragic 82.1% |
| Immigrants | Mexico | 0.0 /100 | #315 | Tragic 82.0% |
| Mexicans | 0.0 /100 | #316 | Tragic 81.9% |
| Chickasaw | 0.0 /100 | #317 | Tragic 81.9% |
| Comanche | 0.0 /100 | #318 | Tragic 81.9% |
| Seminole | 0.0 /100 | #319 | Tragic 81.7% |
| Colville | 0.0 /100 | #320 | Tragic 81.6% |
| Shoshone | 0.0 /100 | #321 | Tragic 81.6% |
Demographics Similar to Somalis by In Labor Force | Age 25-29
In terms of in labor force | age 25-29, the demographic groups most similar to Somalis are Immigrants from Somalia (87.1%, a difference of 0.010%), Carpatho Rusyn (87.0%, a difference of 0.090%), Luxembourger (86.9%, a difference of 0.19%), Slovene (86.4%, a difference of 0.80%), and Immigrants from Bosnia and Herzegovina (86.3%, a difference of 0.93%).
| Demographics | Rating | Rank | In Labor Force | Age 25-29 |
| Tsimshian | 100.0 /100 | #1 | Exceptional 88.7% |
| Immigrants | Somalia | 100.0 /100 | #2 | Exceptional 87.1% |
| Somalis | 100.0 /100 | #3 | Exceptional 87.1% |
| Carpatho Rusyns | 100.0 /100 | #4 | Exceptional 87.0% |
| Luxembourgers | 100.0 /100 | #5 | Exceptional 86.9% |
| Slovenes | 100.0 /100 | #6 | Exceptional 86.4% |
| Immigrants | Bosnia and Herzegovina | 100.0 /100 | #7 | Exceptional 86.3% |
| Immigrants | Cabo Verde | 100.0 /100 | #8 | Exceptional 86.2% |
| Ethiopians | 100.0 /100 | #9 | Exceptional 86.2% |
| Liberians | 100.0 /100 | #10 | Exceptional 86.1% |
| Immigrants | Ethiopia | 100.0 /100 | #11 | Exceptional 86.1% |
| Immigrants | Lithuania | 100.0 /100 | #12 | Exceptional 86.1% |
| Norwegians | 100.0 /100 | #13 | Exceptional 86.1% |
| Latvians | 100.0 /100 | #14 | Exceptional 86.1% |
| Bolivians | 100.0 /100 | #15 | Exceptional 86.1% |