Immigrants from Central America vs Somali In Labor Force | Age 25-29
COMPARE
Immigrants from Central America
Somali
In Labor Force | Age 25-29
In Labor Force | Age 25-29 Comparison
Immigrants from Central America
Somalis
82.4%
IN LABOR FORCE | AGE 25-29
0.0/ 100
METRIC RATING
309th/ 347
METRIC RANK
87.1%
IN LABOR FORCE | AGE 25-29
100.0/ 100
METRIC RATING
3rd/ 347
METRIC RANK
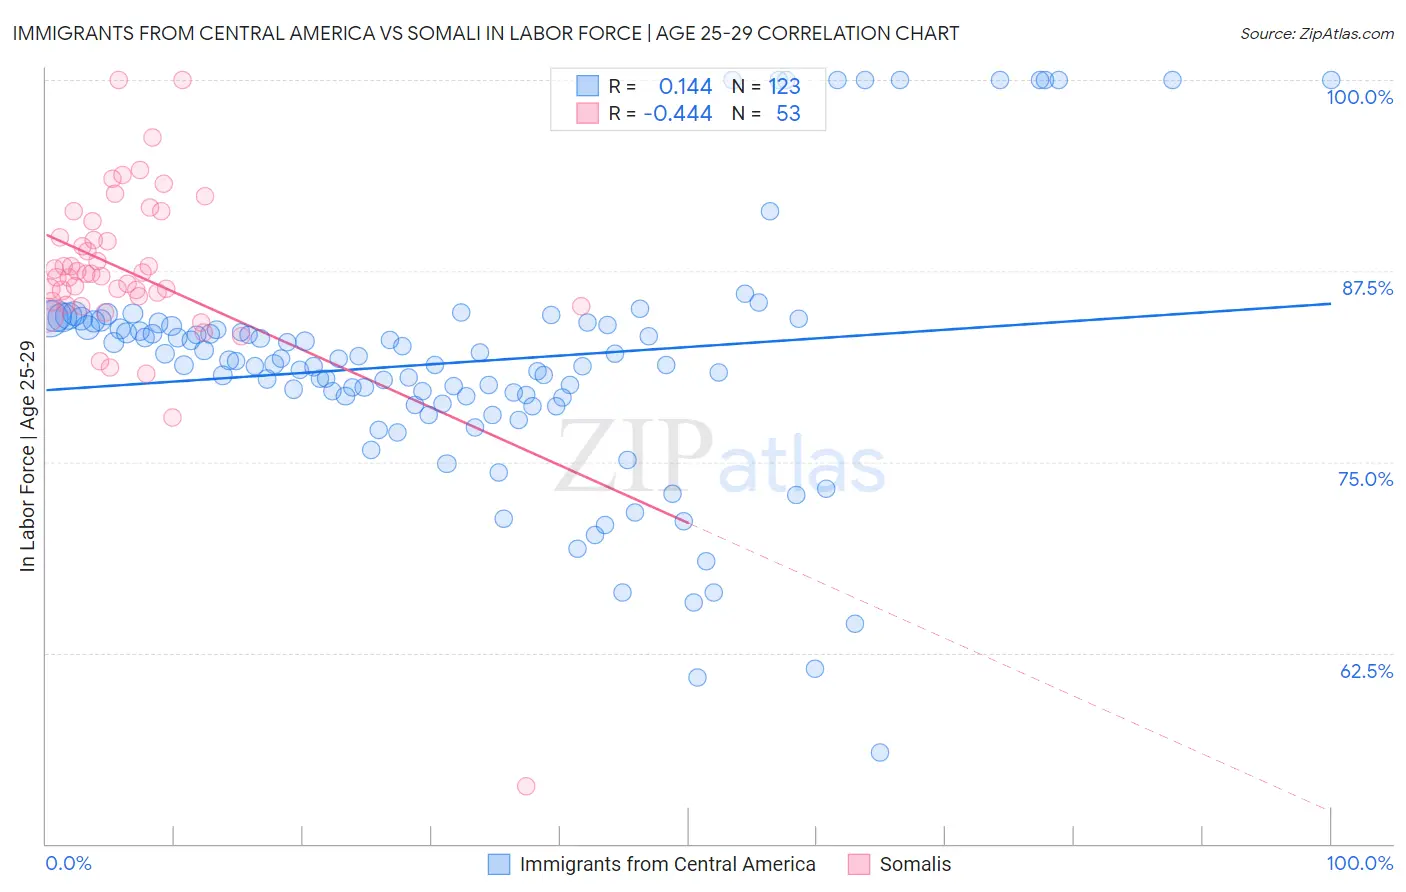
Immigrants from Central America vs Somali In Labor Force | Age 25-29 Correlation Chart
The statistical analysis conducted on geographies consisting of 535,870,907 people shows a poor positive correlation between the proportion of Immigrants from Central America and labor force participation rate among population between the ages 25 and 29 in the United States with a correlation coefficient (R) of 0.144 and weighted average of 82.4%. Similarly, the statistical analysis conducted on geographies consisting of 99,327,159 people shows a moderate negative correlation between the proportion of Somalis and labor force participation rate among population between the ages 25 and 29 in the United States with a correlation coefficient (R) of -0.444 and weighted average of 87.1%, a difference of 5.6%.
In Labor Force | Age 25-29 Correlation Summary
| Measurement | Immigrants from Central America | Somali |
| Minimum | 56.0% | 53.8% |
| Maximum | 100.0% | 100.0% |
| Range | 44.0% | 46.2% |
| Mean | 81.5% | 87.4% |
| Median | 81.6% | 87.3% |
| Interquartile 25% (IQ1) | 78.8% | 85.4% |
| Interquartile 75% (IQ3) | 84.1% | 90.2% |
| Interquartile Range (IQR) | 5.3% | 4.8% |
| Standard Deviation (Sample) | 8.3% | 6.4% |
| Standard Deviation (Population) | 8.2% | 6.3% |
Similar Demographics by In Labor Force | Age 25-29
Demographics Similar to Immigrants from Central America by In Labor Force | Age 25-29
In terms of in labor force | age 25-29, the demographic groups most similar to Immigrants from Central America are Central American Indian (82.4%, a difference of 0.010%), Osage (82.3%, a difference of 0.14%), Alaskan Athabascan (82.3%, a difference of 0.15%), Cajun (82.5%, a difference of 0.16%), and Hispanic or Latino (82.2%, a difference of 0.21%).
| Demographics | Rating | Rank | In Labor Force | Age 25-29 |
| Immigrants | Belize | 0.0 /100 | #302 | Tragic 82.8% |
| Immigrants | Grenada | 0.0 /100 | #303 | Tragic 82.8% |
| Immigrants | St. Vincent and the Grenadines | 0.0 /100 | #304 | Tragic 82.7% |
| Blacks/African Americans | 0.0 /100 | #305 | Tragic 82.6% |
| Blackfeet | 0.0 /100 | #306 | Tragic 82.6% |
| Cajuns | 0.0 /100 | #307 | Tragic 82.5% |
| Central American Indians | 0.0 /100 | #308 | Tragic 82.4% |
| Immigrants | Central America | 0.0 /100 | #309 | Tragic 82.4% |
| Osage | 0.0 /100 | #310 | Tragic 82.3% |
| Alaskan Athabascans | 0.0 /100 | #311 | Tragic 82.3% |
| Hispanics or Latinos | 0.0 /100 | #312 | Tragic 82.2% |
| Yaqui | 0.0 /100 | #313 | Tragic 82.2% |
| Cherokee | 0.0 /100 | #314 | Tragic 82.1% |
| Immigrants | Mexico | 0.0 /100 | #315 | Tragic 82.0% |
| Mexicans | 0.0 /100 | #316 | Tragic 81.9% |
Demographics Similar to Somalis by In Labor Force | Age 25-29
In terms of in labor force | age 25-29, the demographic groups most similar to Somalis are Immigrants from Somalia (87.1%, a difference of 0.010%), Carpatho Rusyn (87.0%, a difference of 0.090%), Luxembourger (86.9%, a difference of 0.19%), Slovene (86.4%, a difference of 0.80%), and Immigrants from Bosnia and Herzegovina (86.3%, a difference of 0.93%).
| Demographics | Rating | Rank | In Labor Force | Age 25-29 |
| Tsimshian | 100.0 /100 | #1 | Exceptional 88.7% |
| Immigrants | Somalia | 100.0 /100 | #2 | Exceptional 87.1% |
| Somalis | 100.0 /100 | #3 | Exceptional 87.1% |
| Carpatho Rusyns | 100.0 /100 | #4 | Exceptional 87.0% |
| Luxembourgers | 100.0 /100 | #5 | Exceptional 86.9% |
| Slovenes | 100.0 /100 | #6 | Exceptional 86.4% |
| Immigrants | Bosnia and Herzegovina | 100.0 /100 | #7 | Exceptional 86.3% |
| Immigrants | Cabo Verde | 100.0 /100 | #8 | Exceptional 86.2% |
| Ethiopians | 100.0 /100 | #9 | Exceptional 86.2% |
| Liberians | 100.0 /100 | #10 | Exceptional 86.1% |
| Immigrants | Ethiopia | 100.0 /100 | #11 | Exceptional 86.1% |
| Immigrants | Lithuania | 100.0 /100 | #12 | Exceptional 86.1% |
| Norwegians | 100.0 /100 | #13 | Exceptional 86.1% |
| Latvians | 100.0 /100 | #14 | Exceptional 86.1% |
| Bolivians | 100.0 /100 | #15 | Exceptional 86.1% |