Immigrants from Lebanon vs Immigrants from Nigeria In Labor Force | Age > 16
COMPARE
Immigrants from Lebanon
Immigrants from Nigeria
In Labor Force | Age > 16
In Labor Force | Age > 16 Comparison
Immigrants from Lebanon
Immigrants from Nigeria
64.5%
IN LABOR FORCE | AGE > 16
3.2/ 100
METRIC RATING
243rd/ 347
METRIC RANK
66.9%
IN LABOR FORCE | AGE > 16
100.0/ 100
METRIC RATING
38th/ 347
METRIC RANK
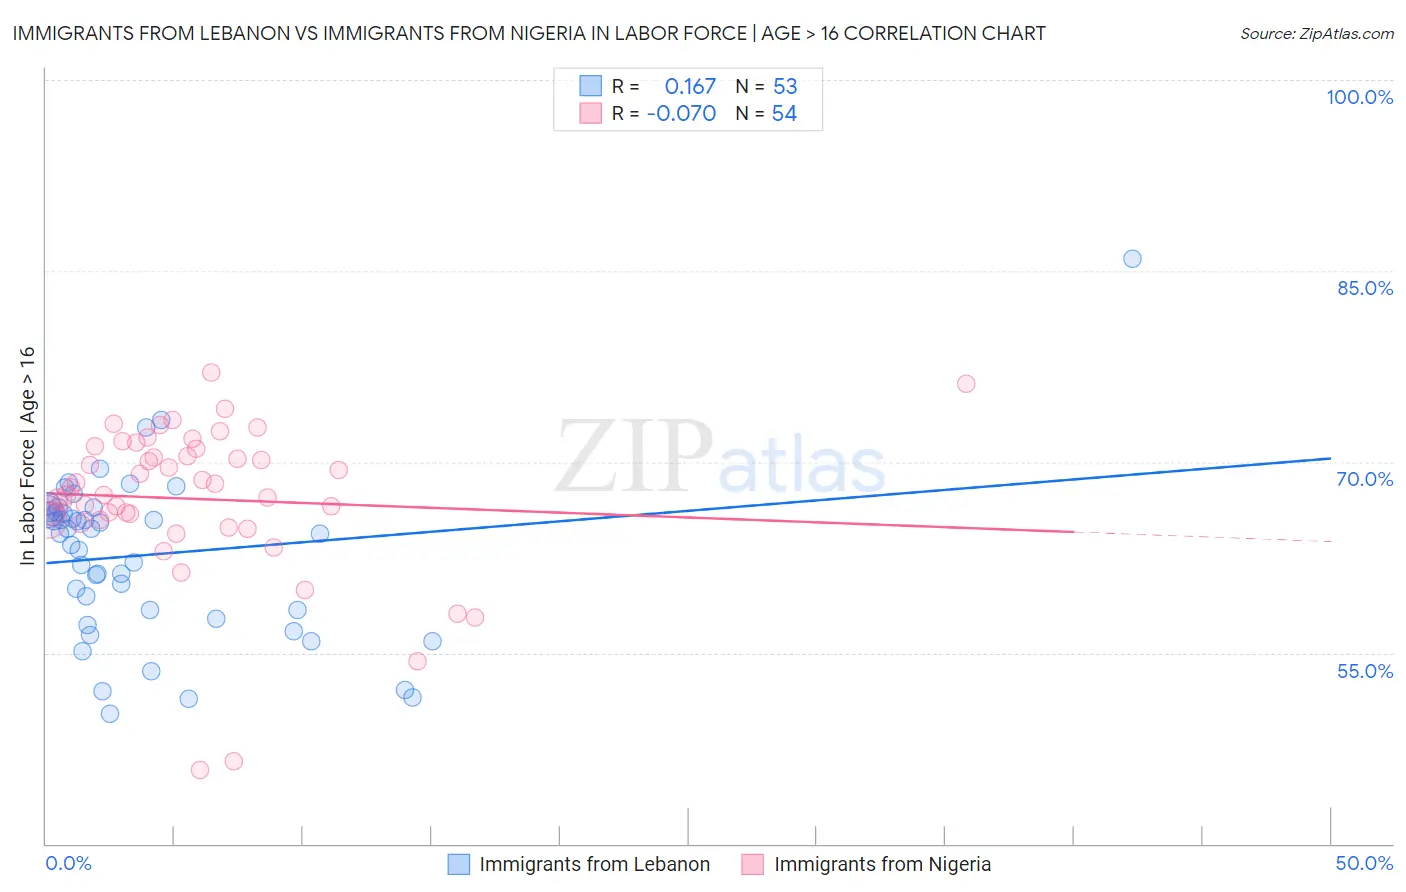
Immigrants from Lebanon vs Immigrants from Nigeria In Labor Force | Age > 16 Correlation Chart
The statistical analysis conducted on geographies consisting of 217,155,604 people shows a poor positive correlation between the proportion of Immigrants from Lebanon and labor force participation rate among population ages 16 and over in the United States with a correlation coefficient (R) of 0.167 and weighted average of 64.5%. Similarly, the statistical analysis conducted on geographies consisting of 283,493,759 people shows a slight negative correlation between the proportion of Immigrants from Nigeria and labor force participation rate among population ages 16 and over in the United States with a correlation coefficient (R) of -0.070 and weighted average of 66.9%, a difference of 3.8%.
In Labor Force | Age > 16 Correlation Summary
| Measurement | Immigrants from Lebanon | Immigrants from Nigeria |
| Minimum | 50.2% | 45.8% |
| Maximum | 86.0% | 77.0% |
| Range | 35.8% | 31.2% |
| Mean | 62.7% | 67.1% |
| Median | 64.4% | 67.7% |
| Interquartile 25% (IQ1) | 58.1% | 65.4% |
| Interquartile 75% (IQ3) | 66.1% | 71.1% |
| Interquartile Range (IQR) | 8.0% | 5.7% |
| Standard Deviation (Sample) | 6.5% | 6.1% |
| Standard Deviation (Population) | 6.4% | 6.0% |
Similar Demographics by In Labor Force | Age > 16
Demographics Similar to Immigrants from Lebanon by In Labor Force | Age > 16
In terms of in labor force | age > 16, the demographic groups most similar to Immigrants from Lebanon are Immigrants from Netherlands (64.5%, a difference of 0.010%), Tsimshian (64.5%, a difference of 0.020%), West Indian (64.5%, a difference of 0.020%), Immigrants from Bangladesh (64.5%, a difference of 0.030%), and Immigrants from Dominica (64.5%, a difference of 0.030%).
| Demographics | Rating | Rank | In Labor Force | Age > 16 |
| Immigrants | Norway | 4.6 /100 | #236 | Tragic 64.6% |
| Italians | 4.6 /100 | #237 | Tragic 64.6% |
| Lebanese | 3.9 /100 | #238 | Tragic 64.5% |
| Immigrants | Hungary | 3.8 /100 | #239 | Tragic 64.5% |
| Immigrants | Bangladesh | 3.6 /100 | #240 | Tragic 64.5% |
| Immigrants | Dominica | 3.5 /100 | #241 | Tragic 64.5% |
| Immigrants | Netherlands | 3.4 /100 | #242 | Tragic 64.5% |
| Immigrants | Lebanon | 3.2 /100 | #243 | Tragic 64.5% |
| Tsimshian | 3.1 /100 | #244 | Tragic 64.5% |
| West Indians | 3.0 /100 | #245 | Tragic 64.5% |
| Immigrants | Caribbean | 2.3 /100 | #246 | Tragic 64.4% |
| Swiss | 2.1 /100 | #247 | Tragic 64.4% |
| Immigrants | Barbados | 2.1 /100 | #248 | Tragic 64.4% |
| Germans | 1.8 /100 | #249 | Tragic 64.4% |
| British West Indians | 1.8 /100 | #250 | Tragic 64.4% |
Demographics Similar to Immigrants from Nigeria by In Labor Force | Age > 16
In terms of in labor force | age > 16, the demographic groups most similar to Immigrants from Nigeria are Immigrants from Afghanistan (67.0%, a difference of 0.12%), Salvadoran (66.8%, a difference of 0.16%), Immigrants from El Salvador (66.8%, a difference of 0.17%), Immigrants from Zimbabwe (66.8%, a difference of 0.17%), and Immigrants from South Central Asia (67.1%, a difference of 0.20%).
| Demographics | Rating | Rank | In Labor Force | Age > 16 |
| Ghanaians | 100.0 /100 | #31 | Exceptional 67.1% |
| Immigrants | Congo | 100.0 /100 | #32 | Exceptional 67.1% |
| Afghans | 100.0 /100 | #33 | Exceptional 67.1% |
| Immigrants | Ghana | 100.0 /100 | #34 | Exceptional 67.1% |
| Immigrants | South Central Asia | 100.0 /100 | #35 | Exceptional 67.1% |
| Immigrants | Western Africa | 100.0 /100 | #36 | Exceptional 67.1% |
| Immigrants | Afghanistan | 100.0 /100 | #37 | Exceptional 67.0% |
| Immigrants | Nigeria | 100.0 /100 | #38 | Exceptional 66.9% |
| Salvadorans | 100.0 /100 | #39 | Exceptional 66.8% |
| Immigrants | El Salvador | 100.0 /100 | #40 | Exceptional 66.8% |
| Immigrants | Zimbabwe | 100.0 /100 | #41 | Exceptional 66.8% |
| Senegalese | 100.0 /100 | #42 | Exceptional 66.7% |
| Luxembourgers | 100.0 /100 | #43 | Exceptional 66.7% |
| Immigrants | Pakistan | 100.0 /100 | #44 | Exceptional 66.7% |
| Immigrants | Brazil | 100.0 /100 | #45 | Exceptional 66.7% |